Help Center/
TaurusDB/
User Guide/
DBA Assistant/
Problem Diagnosis/
Managing Locks and Transactions
Updated on 2024-12-30 GMT+08:00
Managing Locks and Transactions
Functions
Metadata Locks
- Metadata locks (MDLs) are used to ensure consistency between DDL and DML operations. Executing DDL statements on a table generates metadata write locks. If there is a metadata lock, all subsequent SELECT, DML, and DDL operations on the table will be blocked, causing a connection backlog.
- Metadata locks are displayed in real time. You can quickly identify locking problems and terminate the sessions holding metadata locks to restore blocked operations.
- DML locks are not included on this page. You can view and analyze them on the InnoDB Locks page.
- A maximum of 1,000 records can be displayed.
InnoDB Locks
- InnoDB lock waits generated before DML operations are displayed in real time. You can quickly locate the session waits and blocks that happened when multiple sessions update the same piece of data at the same time, and can terminate the source sessions that hold locks to restore blocked operations.
- DDL locks are not included on this page. You can view and analyze them on the Metadata Locks page.
- Lock information can be viewed only when Performance Schema is enabled. To check the Performance Schema status, run SHOW GLOBAL VARIABLES LIKE "performance_schema" or go to the Parameters page of TaurusDB.
Deadlock Analysis
- This function analyzes the latest deadlock log returned by SHOW ENGINE INNODB STATUS. If there have been multiple deadlocks, only the latest deadlock is analyzed.
- You can query lock analysis data of the past seven days.
Full Deadlock Analysis
- The kernel version of your TaurusDB instance must be 2.0.45.230900 or later.
- After this function is enabled, the system regularly examines error logs, extracts deadlock details from them, and conducts a full deadlock analysis.
- The following parameters must be enabled:
innodb_deadlock_detect (This parameter is enabled by default.)
- A maximum of 10,000 records can be displayed.
- You can query lock analysis data of the past seven days.
Procedure
- Log in to the management console.
- Click
 in the upper left corner and select a region and project.
 - Click
 in the upper left corner of the page and choose Databases > TaurusDB.
 - On the Instances page, click the instance name.
- In the navigation pane, choose DBA Assistant > Real-Time Diagnosis.
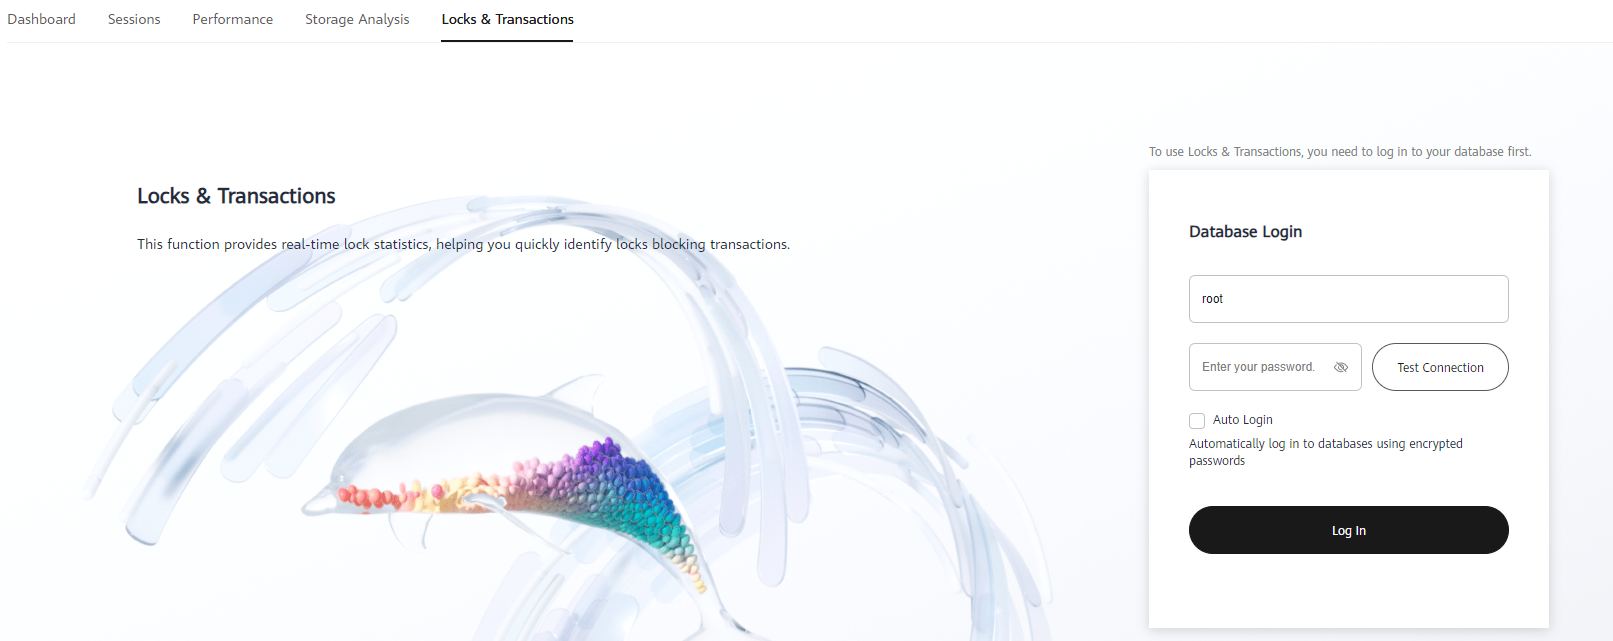
- Click the Locks & Transactions tab and enter the administrator password to log in to the instance.
Figure 1 Logging in to an instance

- On the Metadata Locks page, filter the desired metadata locks by session ID, lock status, lock type, and database name.

- Check whether there are any sessions with metadata locks.
If so, select the sessions and click Kill Session.
- On the InnoDB Locks page, check whether there are any lock waits.

- On the Deadlock Analysis page, view the latest lock analysis data. You can click Create Lock Analysis to create a lock analysis data record.

- Enable Full Deadlock Analysis on the Full Deadlock Analysis page and set the innodb_print_all_deadlocks parameter to ON to view the full deadlock analysis data.
Parent topic: Problem Diagnosis
Feedback
Was this page helpful?
Provide feedbackThank you very much for your feedback. We will continue working to improve the documentation.See the reply and handling status in My Cloud VOC.
The system is busy. Please try again later.
For any further questions, feel free to contact us through the chatbot.
Chatbot


