
Viewing Slow Query Logs of a Database Proxy
Scenarios
After slow query logging is enabled for a database proxy, statements whose execution time (from the time when the proxy receives a client request to the time when all result sets are returned to the client) exceeds a threshold are logged. By analyzing these proxy logs alongside database slow query logs and client request time, you can identify potential bottlenecks and optimize the query performance. To view database slow query logs, see Viewing and Downloading Slow Query Logs.
Constraints
Slow query logs generated within the past month can be viewed.
Parameter Description
|
Parameter |
Description |
|---|---|
|
slowLogQueryTime |
The execution duration threshold (in ms) of SQL statements. If this threshold is exceeded, the statements will be recorded in proxy slow query logs. Default value: 500 If you modify this parameter, the modification is applied immediately. Modifying this parameter does not affect existing slow query logs. |
Procedure
- Click
 in the upper left corner and select a region.
 - Click
 in the upper left corner of the page and choose Databases > Relational Database Service.
 - In the instance list, click the target instance name to go to the Summary page.
- In the navigation pane on the left, choose Database Proxy.
- In the proxy information area, click Manage Logs.
- Click
 to enable slow query log collection.
 - On the Slow Query Logs tab page, select a time range to view details about slow SQL statements.
Figure 1 Slow query log details
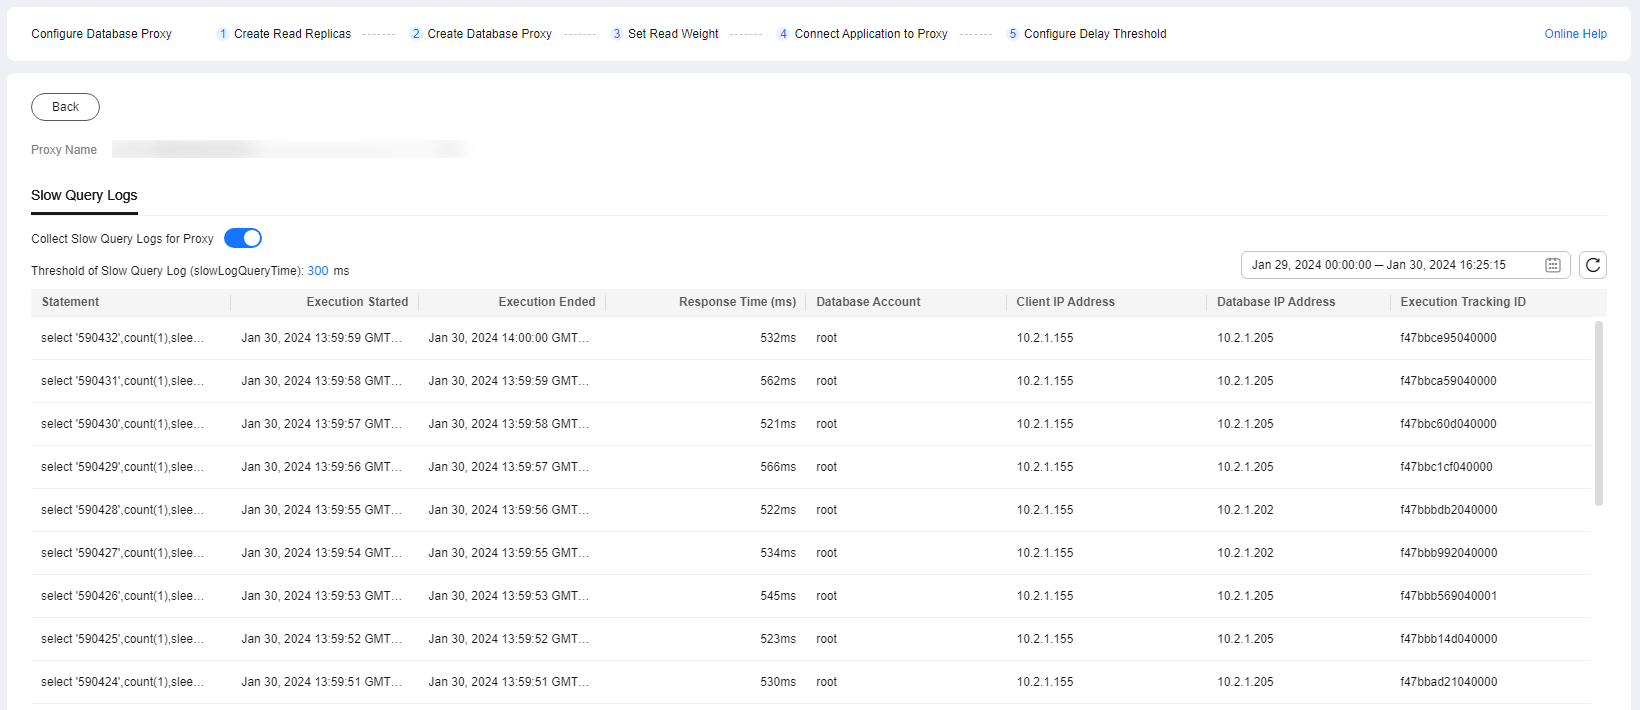
- Slow query logs record executed statements whose execution duration exceeds the threshold.
- The slowLogQueryTime parameter defines the SQL execution time for a query to be considered slow and recorded in the slow query log. However, if you modify this parameter, the change does not affect already recorded logs. For example, if you change the value of this parameter from 500 to 300 (unit: ms), RDS starts recording statements that meet the new threshold and still displays the previously recorded logs that do not meet the new threshold.
- Slow query logs are displayed in log loading mode. There is no upper limit on the number of log records displayed within the query time range, and the total number of log records is not displayed.
Feedback
Was this page helpful?
Provide feedbackThank you very much for your feedback. We will continue working to improve the documentation.See the reply and handling status in My Cloud VOC.
For any further questions, feel free to contact us through the chatbot.
Chatbot


