
Checking the Dashboard
The pipeline statistics dashboard displays pipelines, their execution statuses, parallel executions in the system and in each project.
Prerequisites
You have enabled and authorized CodeArts Pipeline.
Checking the Dashboard
- Access the CodeArts Pipeline homepage.
- The dashboard displays pipeline statistics.
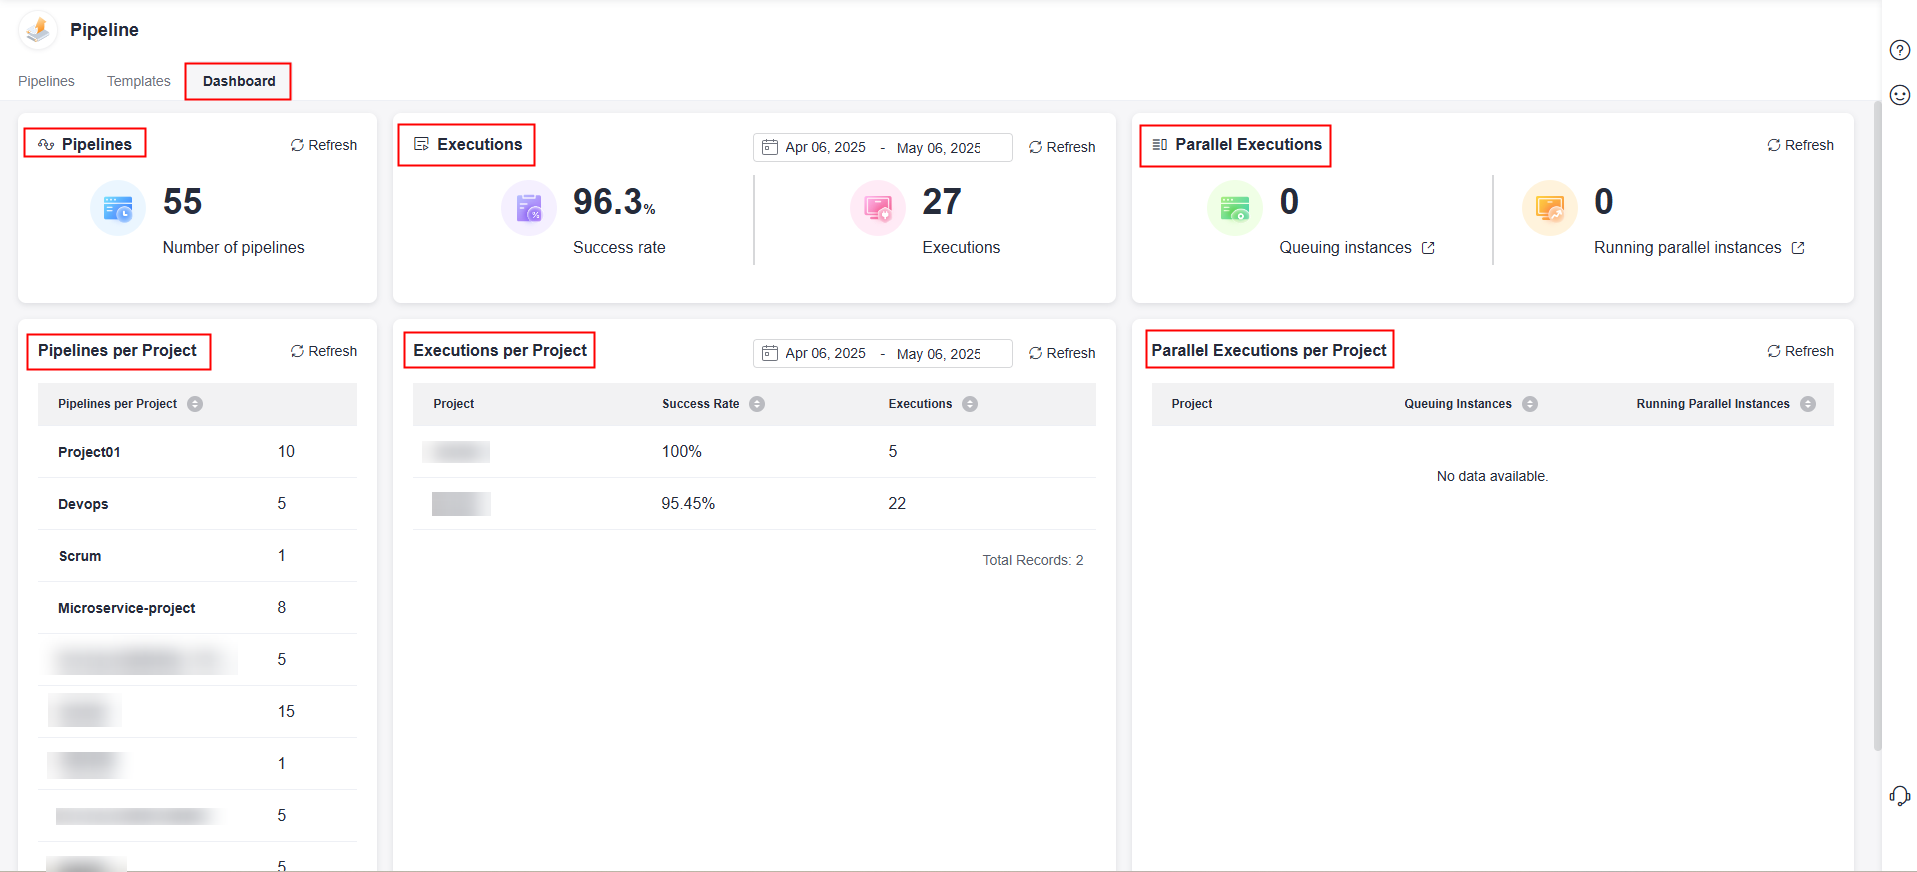
Table 1 Pipeline statistics Item
Description
Pipelines
Total number of pipelines.
Executions
Execution success rate and execution times. You can check executions within 90 days.
Parallel Executions
Number of queuing and running parallel instances.
- Click
 on the right of the queuing instances. The Queuing Instances window is displayed for you to check the queuing pipelines and triggers.
 - Click
 on the right of the running parallel instances. The Running Instances window is displayed for you to check the names, execution information, triggers, and execution time of running pipelines.
Pipelines per Project
Number of pipelines in each project. You can click a project name to access pipelines in this project.
Executions per Project
Execution success rate and execution times in each project. You can check executions during a specified period. You can also click a project name to access pipelines in this project.
Parallel Executions per Project
Number of queuing and running parallel instances in each project.
- Click
Feedback
Was this page helpful?
Provide feedbackThank you very much for your feedback. We will continue working to improve the documentation.See the reply and handling status in My Cloud VOC.
For any further questions, feel free to contact us through the chatbot.
Chatbot


