Debugging an Application
After a single-agent application is set up, you can communicate with it directly, monitor its execution process and responses in real time, and adjust its configuration as needed. With the full-link debugging function, you can view the entire process of each user request from input to response, accurately locate problems, and quickly adjust configurations.
Debugging an Application
You can debug the execution process of a created agent on the platform.
To debug an application, perform the following steps:
- Log in to the agent development platform.
- In the navigation pane, choose Application Management. On the top of the page, select Single Intelligent Agent Application. The application development page is displayed.
- Click the application to be debugged to go to the application details page.
- On the application details page, click the drop-down list next to Model in the upper right corner. In the dialog box that is displayed, set model parameters by referring to Table 1.
Table 1 Model parameter configuration Parameter
Description
Model selection
Select the model to be used. The effect of different models varies.
Mode selection
Configure the output diversity of the model.
The options are as follows:
- Accurate: The model output strictly follows the instruction requirements. The model may repeatedly discuss a topic or frequently use the same words.
- Balanced: The model output is a balance between randomness and accuracy.
- Creative: The model output is more diversified and innovative, and may deviate from the main purpose in some scenarios.
- Custom: Customize the Temperature and Top P settings of the model output to generate the expected output.
Temperature
Increasing the temperature makes the model output more diversified and creative. Reducing the temperature makes the output more compliant with the instruction requirements but reduces the diversity. The value ranges from 0 to 1.
- Increasing the value of this parameter makes the model output more diversified and creative.
- Decreasing the value of this parameter makes the model output more compliant with the instruction requirements but less diversified.
In fact-based Q&A scenarios, you can set this parameter to a small value to obtain more realistic and concise answers. For creative tasks such as novel creation, you can set this parameter to a larger value. You are advised not to adjust this parameter together with the nuclear sampling parameter.
Top P
The model selects words starting from the word with the highest probability until the cumulative probability of these words reaches the Top P value. The Top P value can limit the model to select these high-probability words, thereby controlling the diversity of the output content. The value ranges from 0.1 to 1.
- Enter a dialog in the Preview Debugging text box on the right. The agent generates a response based on the dialog.
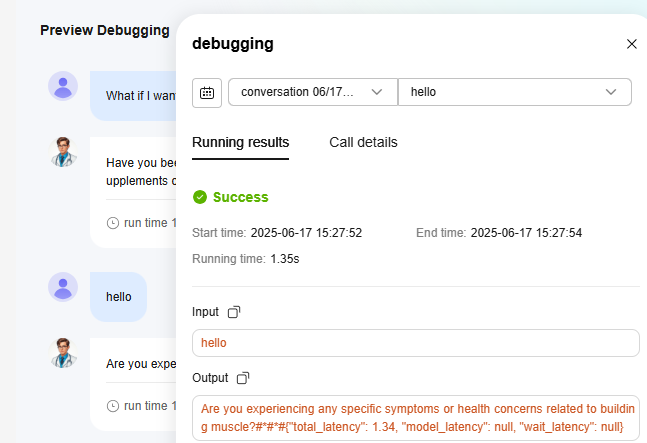
- During debugging, click debugging in the upper right corner to view the running results and call details of the current or historical session.
Figure 1 Debugging results

Debugging Details
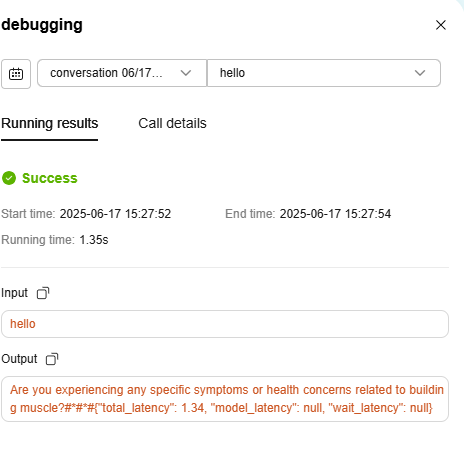
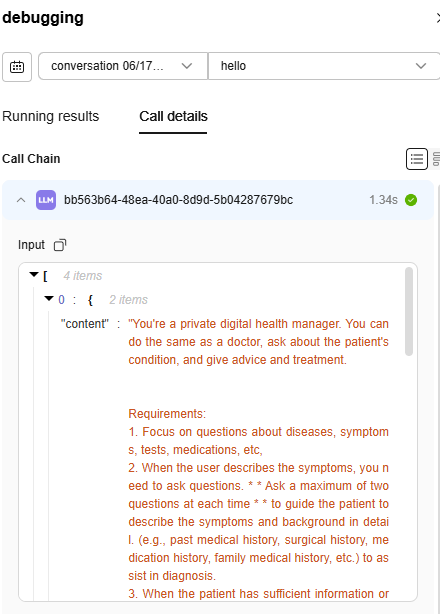
There are two tab pages on the debugging page: Running results and Call details.
- Running results
You can view the execution start time, end time, duration, input information, and output information of the agent. This provides you with a clear overview of the agent performance.

- Call details
When an agent is triggered, the Call Chain area displays details about the events, including the triggered component, event duration, and event input and output information. This helps developers quickly trace the operation sequence and accurately locate faults.

Feedback
Was this page helpful?
Provide feedbackThank you very much for your feedback. We will continue working to improve the documentation.See the reply and handling status in My Cloud VOC.
For any further questions, feel free to contact us through the chatbot.
Chatbot


