ALM-19009 Direct Memory Usage of the HBase Process Exceeds the Threshold
Description
The system checks the HBase service status every 30 seconds. The alarm is generated when the direct memory usage of an HBase service exceeds the threshold (90% of the maximum memory).
The alarm is cleared when the direct memory usage is less than the threshold.
Attribute
|
Alarm ID |
Alarm Severity |
Automatically Cleared |
|---|---|---|
|
19009 |
Major |
Yes |
Parameters
|
Name |
Meaning |
|---|---|
|
Source |
Specifies the cluster for which the alarm is generated. |
|
ServiceName |
Specifies the service name for which the alarm is generated. |
|
RoleName |
Specifies the role name for which the alarm is generated. |
|
HostName |
Specifies the object (host ID) for which the alarm is generated. |
Impact on the System
The available HBase direct memory is insufficient, which may cause node restart. During the node restart, the read/write request delay on the node increases or fails.
Possible Causes
The direct memory of the HBase service is overused or the direct memory is inappropriately allocated.
Procedure
Check direct memory usage.
- On the FusionInsight Manager portal, click and select the alarm whose ID is 19009. Check the RoleName in Location and confirm the IP address of HostName.
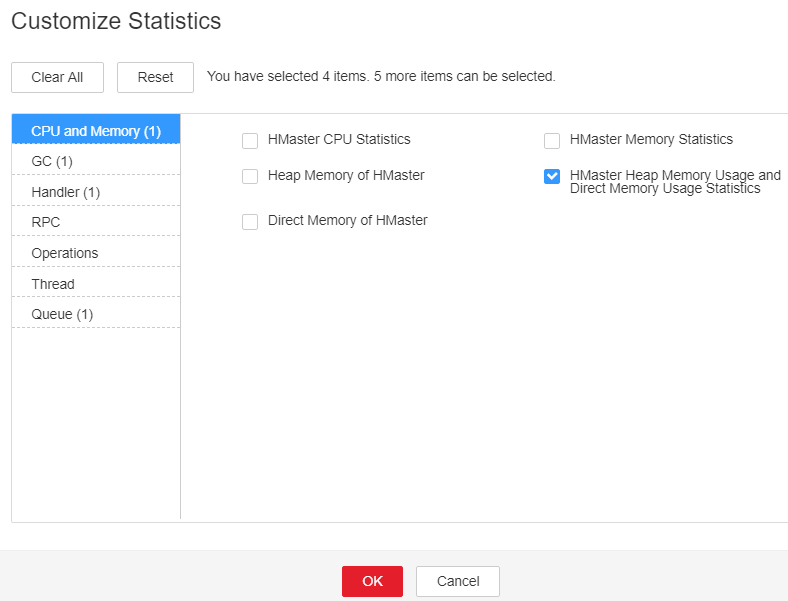
- On the FusionInsight Manager portal, choose Cluster > Name of the desired cluster > Services > HBase > Instance and click the HMaster for which the alarm is generated to go to the Dashboard page. Click the drop-down menu in the Chart area and choose Customize > CPU and Memory > HMaster Heap Memory Usage and Direct Memory Usage Statistics and click OK to check whether the used direct memory of the HBase service reaches 90% of the maximum direct memory specified for HBase.
Figure 1 HMaster Heap Memory Usage and Direct Memory Usage Statistics

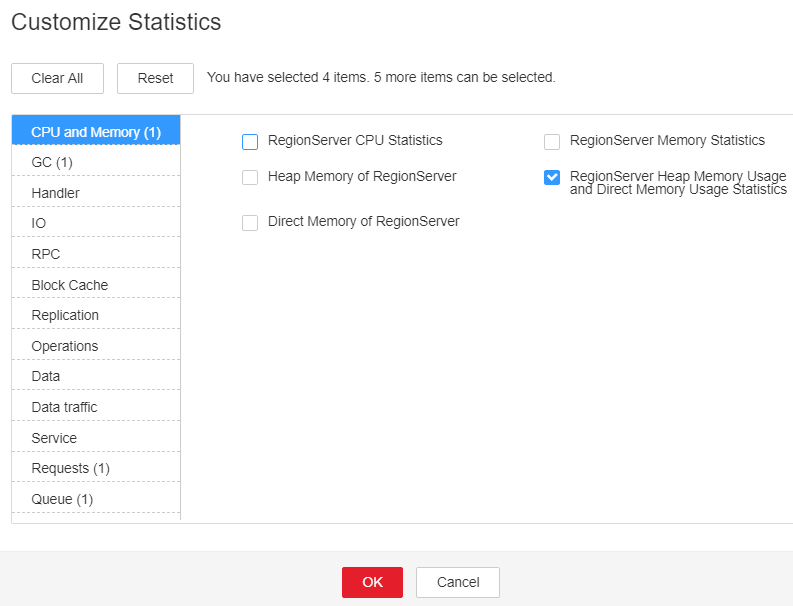
- On the FusionInsight Manager portal, choose Cluster > Name of the desired cluster > Services > HBase > Instance and click the RegionServer for which the alarm is generated to go to the Dashboard page. Click the drop-down menu in the Chart area and choose Customize > CPU and Memory > RegionServer Heap Memory Usage and Direct Memory Usage Statistics and click OK to check whether the used direct memory of the HBase service reaches 90% of the maximum direct memory specified for HBase.
Figure 2 RegionServer Heap Memory Usage and Direct Memory Usage Statistics

- On the FusionInsight Manager portal, choose Cluster > Name of the desired cluster > Services > HBase > Configurations, and click All Configurations. Choose HMaster/RegionServer > System and check whether XX:MaxDirectMemorySize exists in GC_OPTS.
- On the FusionInsight Manager portal, choose Cluster > Name of the desired cluster > Services > HBase > Configurations, and click All Configurations. Choose HMaster/RegionServer > System and delete XX:MaxDirectMemorySize from GC_OPTS.
- Check whether the ALM-19008 Heap Memory Usage of the HBase Process Exceeds the Threshold alarm is generated.
- If yes, handle the alarm by referring to ALM-19008 Heap Memory Usage of the HBase Process Exceeds the Threshold.
- If no, go to Step 8.
- Check whether the alarm is cleared.
- If yes, no further action is required.
- If no, go to Step 8.
Collect fault information.
- On the FusionInsight Manager interface of active and standby clusters, choose O&M > Log > Download.
- In the Service in the required cluster drop-down list box, select HBase.
- Click
 in the upper right corner, and set Start Date and End Date for log collection to 10 minutes ahead of and after the alarm generation time, respectively. Then, click Download.
 - Contact the O&M personnel and send the collected fault logs.
Alarm Clearing
After the fault is rectified, the system automatically clears this alarm.
Related Information
None
Feedback
Was this page helpful?
Provide feedbackThank you very much for your feedback. We will continue working to improve the documentation.See the reply and handling status in My Cloud VOC.
For any further questions, feel free to contact us through the chatbot.
Chatbot


