
Viewing Metrics
You can view the Content Moderation monitoring metrics on the Cloud Eye console or by using the APIs provided by Cloud Eye.
Namespace
SYS.MODERATION
Content Moderation Metrics
|
Metric ID |
Metric Name |
Description |
Value Range |
Monitored Object |
Monitoring Period (Raw Metric) |
|---|---|---|---|---|---|
|
successful_call_times_of_service |
Successful Calls of Service |
Number of successful calls to the service Unit: calls/min |
≥ 0 times/min |
Content Moderation APIs |
1 min |
|
failed_call_times_of_service |
Failed Calls of Service |
Number of failed calls to the service Unit: calls/min |
≥ 0 times/min |
Content Moderation APIs |
1 min |
Viewing Metrics
The following steps use Text Moderation as an example.
- Log in to the Content Moderation management console.
- In the left navigation pane, choose Service List > Text Moderation. Move the cursor to the bottom of the page and click View Metric.
Figure 1 Viewing metrics

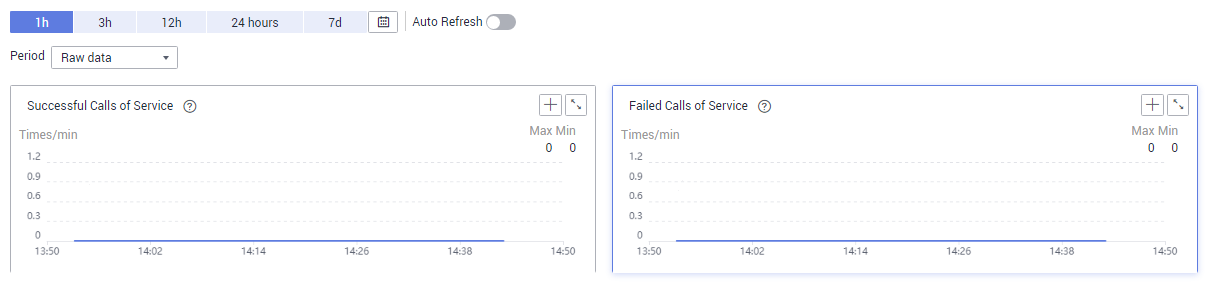
- On the displayed Cloud Eye console, set the time range and view metrics such as Successful Calls of Service and Failed Calls of Service.
Figure 2 Viewing metrics
Feedback
Was this page helpful?
Provide feedbackThank you very much for your feedback. We will continue working to improve the documentation.See the reply and handling status in My Cloud VOC.
For any further questions, feel free to contact us through the chatbot.
Chatbot


