Handling Server Alarms
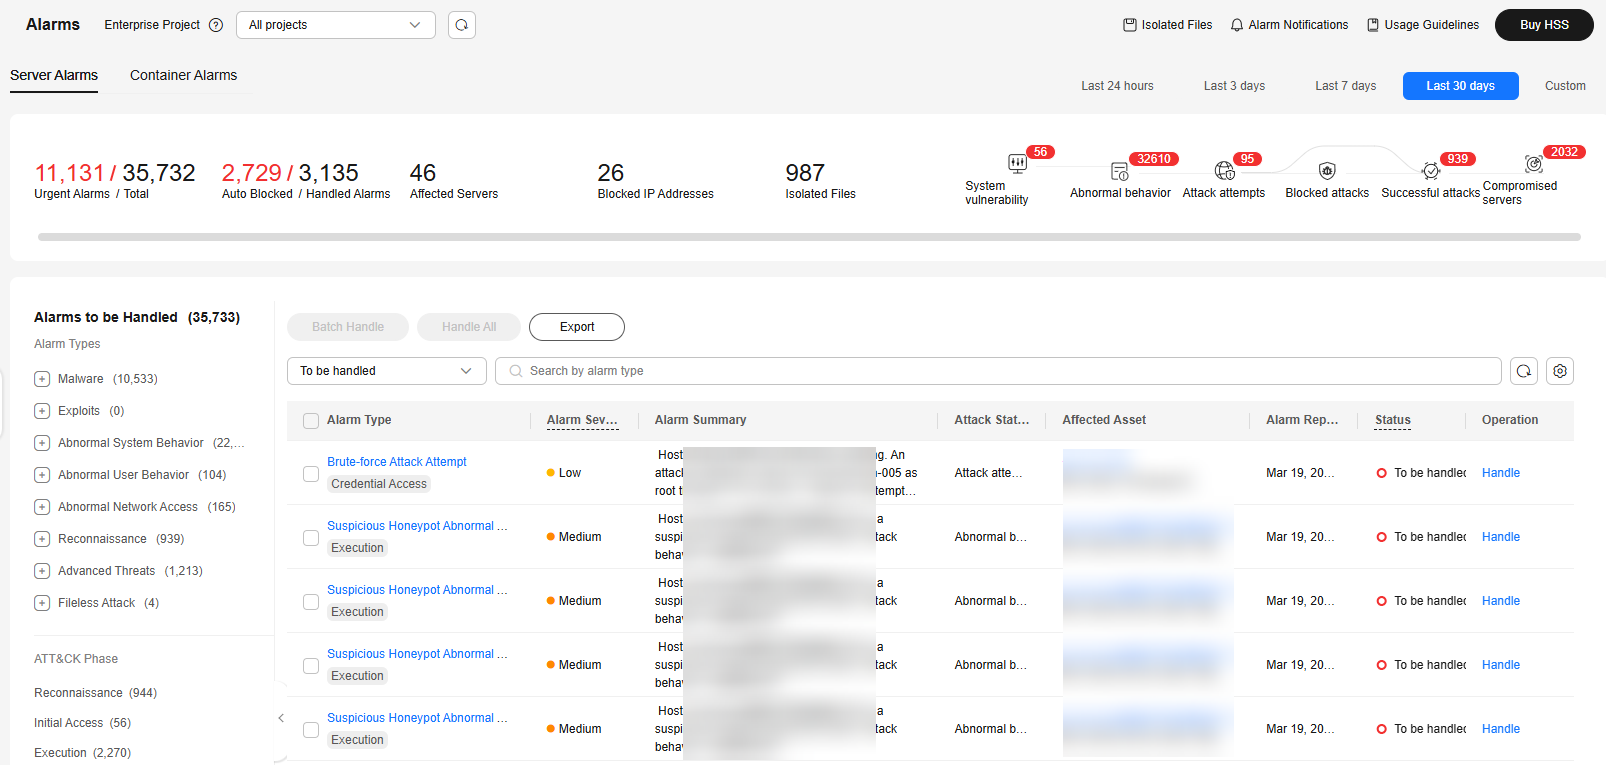
HSS displays alarm and event statistics and their summary all on one page. You can have a quick overview of alarms, including the numbers of urgent alarms, total alarms, servers with alarms, blocked IP addresses, and isolated files.
The Events page displays the alarms generated in the last 30 days.
The status of a handled alarm changes from Unhandled to Handled.

Alarms generated by AV detection and HIPS detection are displayed under different types of events.
- Alarms generated by AV detection are displayed only under the Malware events.
- Alarms generated by HIPS detection are displayed in subcategories of all events.
Constraints
- To skip the checks on high-risk command execution, privilege escalations, reverse shells, abnormal shells, or web shells, manually disable the corresponding policies in the policy groups on the Policies page. HSS will not check the servers associated with disabled policies. For details, see Viewing a Policy Group.
- Other detection items cannot be manually disabled.
- Servers that are not protected by HSS do not support operations related to alarms and events.
- Alarms reported by the graph engine cannot be handled in batches.
Handling Server Alarms
This section describes how you should handle alarms to enhance server security.

Do not fully rely on alarm handling to defend against attacks, because not every issue can be detected in a timely manner. You are advised to take more measures to prevent threats, such as checking for and fixing vulnerabilities and unsafe settings.
- Log in to the HSS console.
- Click
 in the upper left corner and select a region or project.
 - In the navigation pane on the left, choose Detection & Response > Alarms and click Server Alarms.
Figure 1 Server alarms

- (Optional) If you have enabled the enterprise project function, select an enterprise project from the Enterprise Project drop-down list in the upper part of the page to view its data.
- Click an alarm name to view the alarm details and suggestions.
- Handle alarms.
Check and handle alarms as needed. The status of a handled alarm changes from Unhandled to Handled.
- In the Handle Event dialog box, select an action. For details about the alarm handling actions, see Table 1.
When you handle one or multiple alarm events, you can select Handle duplicate alarms in batches in the Handle Event dialog box.When handling a graph engine alarm, you can select different handling methods for different suspicious processes or files.
Table 1 Alarm handling methods Action
Description
Ignore
Ignore the current alarm. Any new alarms of the same type will still be reported by HSS.
Isolate and kill
If a program is isolated and killed, it will be terminated immediately and no longer able to perform read or write operations. Isolated source files of programs or processes are displayed on the Isolated Files slide-out panel and cannot harm your servers.
You can click Isolated Files on the upper right corner to check the files. For details, see Managing Isolated Files.
For details about events that can be isolated and killed, see Server Alarms.
NOTE:When a program is isolated and killed, the process of the program is terminated immediately. To avoid impact on services, check the detection result, and cancel the isolation of or unignore misreported malicious programs (if any).
Mark as handled
If you have manually handled an event, choose Mark as handled. You can add remarks to record details about event handling.
Add to process whitelist
If you can confirm that a process triggering an alarm can be trusted, you can add it to the process whitelist. HSS will no longer report alarms on whitelisted processes.
Add to Login Whitelist
Add false alarmed items of the Brute-force attack and Abnormal login types to the Login Whitelist.
HSS will no longer report alarms on the Login Whitelist. A whitelisted login event will not trigger alarms.
The following alarm events can be added:
- Brute-force attacks
- Abnormal logins
Add to alarm whitelist
Add false alarmed items to the login whitelist.
HSS will no longer report alarms on the whitelisted items. A whitelisted alarm will not trigger alarms.
After adding an alarm to the alarm whitelist, you can customize a whitelist rule. The custom rule types vary depending on the alarm types, including the file path, process path, process command line, remote IP address, and user name. If a detected alarm event hit the rule you specified, HSS does not generate an alarm.
For details about events that can be isolated and killed, see Server Alarms.
- Click OK.
You check handled alarms. For details, see Handling History.
Viewing the Handling History of an Alarm
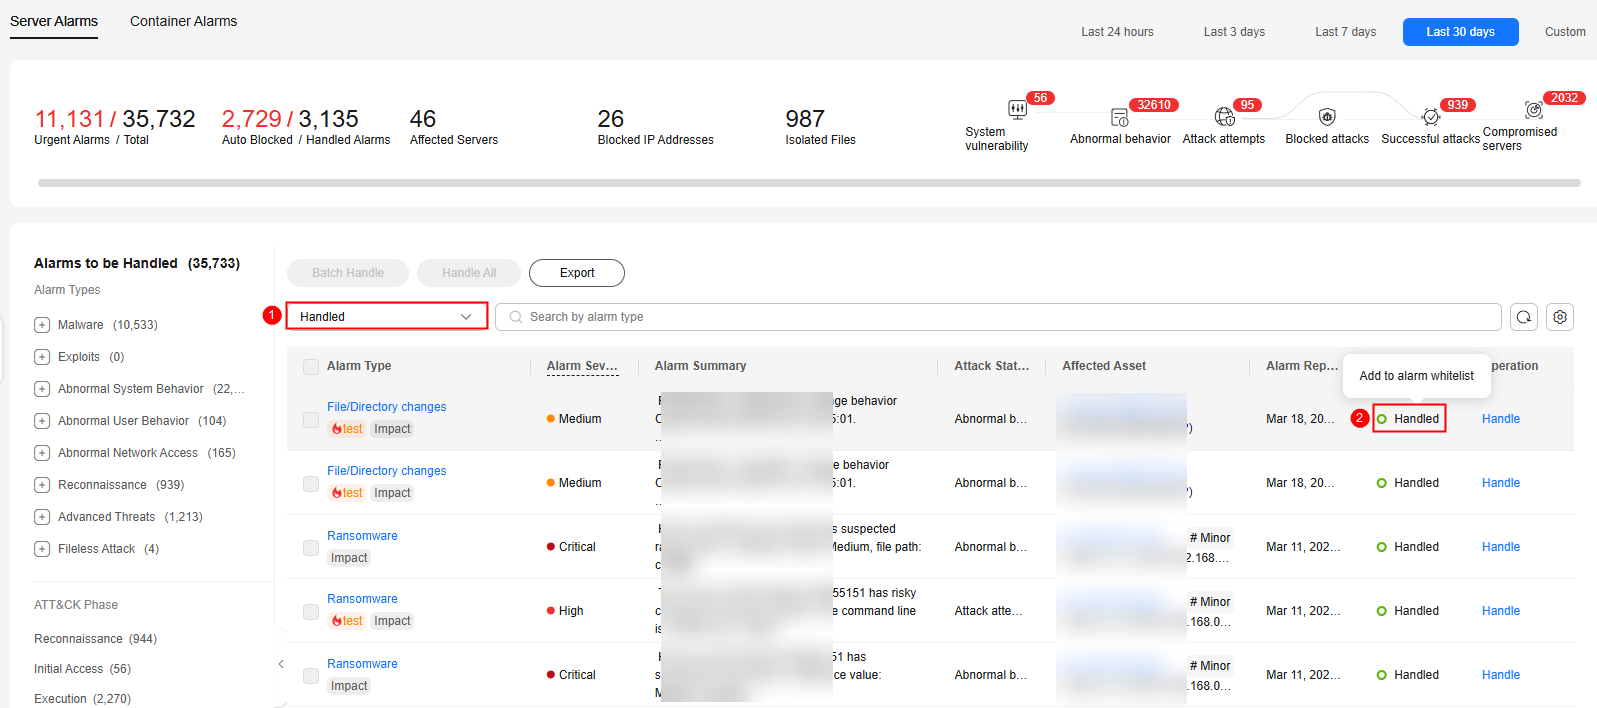
- In the alarm event list, filter handled alarms.
- Hover the cursor over Status of an alarm to view its handling history.
Figure 3 Viewing the handling history of an alarm

Canceling Handled Server Alarms
You can cancel the processing of a handled alarm event.
- In the alarm event list, filter handled alarms.
- In the Operation column of an alarm, click Handle.
- In the Handle Alarm Event dialog box, click OK to cancel the last handling.
Feedback
Was this page helpful?
Provide feedbackThank you very much for your feedback. We will continue working to improve the documentation.See the reply and handling status in My Cloud VOC.
For any further questions, feel free to contact us through the chatbot.
Chatbot


