Viewing Application Protection
Scenario
After application protection is enabled, you can view the protection status and events on the Application Protection page. You can analyze the events and harden your applications accordingly.
Checking the Protection Status
- Log in to the HSS console.
- Click
 in the upper left corner and select a region or project.
 - Choose . Click the Servers tab.
Figure 1 Viewing protected assets

- (Optional) If you have enabled the enterprise project function, select an enterprise project from the Enterprise Project drop-down list in the upper part of the page to view its data.
- Check the service protection status. For details, see Table 1.
Table 1 Protected asset parameters Parameter
Description
Asset Name/IP Address
Name and IP address of a server or container node.
OS
OS type of an asset.
Protection Policy
Application protection policy bound to an asset.
RASP Status
Application protection status.
- Unprotected: The asset has been added for protection but RASP is not enabled.
- Enabling: RASP is being enabled.
- Partially protected: RASP is enabled for some applications, and not enabled or failed to be enabled for others.
- Protected: RASP is enabled for all applications.
- Protection failed: RASP fails to be enabled due to an exception.
- Disabling: Application protection is being disabled.
Protected/Accessed Applications
Number of protected applications and the total number of applications that can be protected.
RASP Port
Port used by the RASP probe to communicate with HSS.
RASP Attacks
Application protection events.
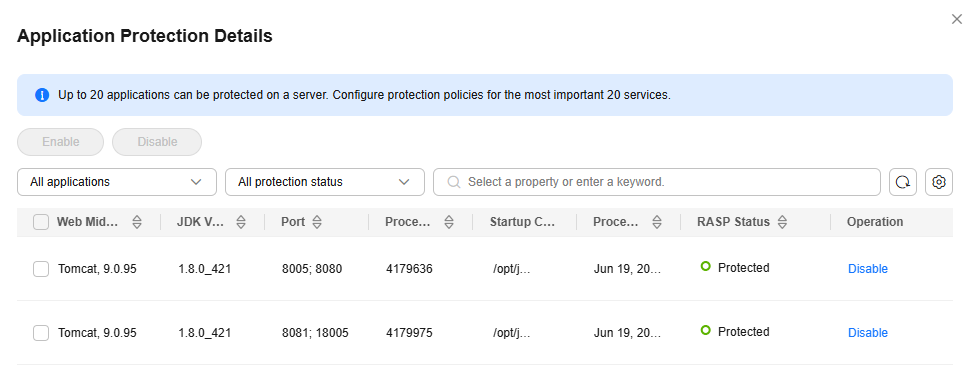
- In the Operation column of an asset, click View Details to view the application protection details.
On the protection details page, you can check the RASP status of each application.Figure 2 Application protection details

Checking and Handling Protection Events
- On the Application Protection page, click the Events tab page to view the protection event list.
You can also click the value in the RASP Attacks column of an asset to go to the Events tab page.
- Check whether an event is an exception based on the event information. For more information, see Table 2.
Figure 3 Events

Table 2 Event parameters Parameter
Description
Alarm Type
Name of an alarm event. You can click the name to view the alarm description, suggestion, and forensics.
Alarm Severity
Alarm severity. You can search for servers by alarm severities.
- Critical: A critical alarm indicates that the system is severely attacked, which may cause data loss, system breakdown, or long service interruption. For example, such alarms are generated if ransomware encryption behaviors or malicious programs are detected. You are advised to handle the alarms immediately to avoid severe system damage.
- High: A high-risk alarm indicates that the system may be under an attack that has not caused serious damage. For example, such alarms are generated if unauthorized login attempts are detected or unsafe commands (for deleting critical system files or modifying system settings) are executed. You are advised to investigate and take measures in a timely manner to prevent attacks from spreading.
- Medium: A medium-risk alert indicates that the system has potential security threats, but there are no obvious signs of being attacked. For example, if abnormal modifications of a file or directory are detected, there may be potential attack paths or configuration errors in the system. You are advised to further analyze and take proper preventive measures to enhance system security.
- Low: A low-risk alarm indicates that a minor security threat exists in the system but does not have significant impact on your system. For example, such alarms are generated if port scans are detected, indicating that there may be attackers trying to find system vulnerabilities. These alarms do not require immediate emergency measures. If you have high requirements on asset security, pay attention to the security alarms of this level.
Alarm Summary
Brief alarm information.
Container Status
Current container status.
Pod Name
Pod where an alarm is reported.
Attack Status
Attack chain phase.
Affected Asset
Information about the server or container affected by an alarm.
Alarm Reported
Time when an alarm is reported.
Status
Alarm handling status.
- In the Operation column of an alarm, click Handle.
- Select a handling method and click OK. For more information, see Table 3.
Application protection events are displayed on the page. If you handle an event on the Application Protection or Alarms page, the handling status will also be updated on the other page.
Table 3 Parameters for handling alarm events Parameter
Description
Action
- Mark as handled: Select this if you have manually handled the event, for example, by fixing a vulnerability.
- Ignore: Select this to ignore the current alarm. Any new alarms of the same type will still be reported by HSS.
Batch Handle
If multiple alarms of the same type are triggered at the same time, you can handle them in batches.
Remarks
Add remarks as needed.
Feedback
Was this page helpful?
Provide feedbackThank you very much for your feedback. We will continue working to improve the documentation.See the reply and handling status in My Cloud VOC.
For any further questions, feel free to contact us through the chatbot.
Chatbot


