Updated on 2025-11-24 GMT+08:00
Checking GaussDB Monitoring Dashboards
Scenarios
On the GaussDB console, you can see real-time performance metrics for your instances and historical performance metrics on different components of the specified instance.
Precautions
- The instance and nodes must be specified.
- You can select a maximum of nine nodes at a time.
- You can select a maximum of nine components at a time.
Procedure
- Log in to the management console.
- Click
 in the upper left corner and select a region and project.
 - Click
 in the upper left corner of the page and choose .
 - Choose Monitoring and Inspection > Monitoring Dashboards.
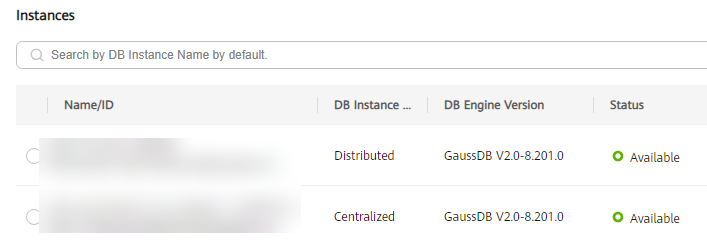
- On the Monitoring Dashboards page, select the specified instance and nodes.
Figure 1 Selecting an instance
 Figure 2 Selecting nodes
- Click View Metrics.
- Select a time segment and click
 to view corresponding metric data.
Figure 3 Viewing metric data
Feedback
Was this page helpful?
Provide feedbackThank you very much for your feedback. We will continue working to improve the documentation.See the reply and handling status in My Cloud VOC.
The system is busy. Please try again later.
For any further questions, feel free to contact us through the chatbot.
Chatbot


