
Overview
A SQL execution plan is a node tree, which displays detailed procedure when GaussDB runs a SQL statement. A database operator indicates one step.
You can run the EXPLAIN command to view execution plans generated for each query by an optimizer. The output of EXPLAIN has one row for each execution node, showing the basic node type and the cost estimation that the optimizer made for the execution of this node. Figure 1 shows an example.
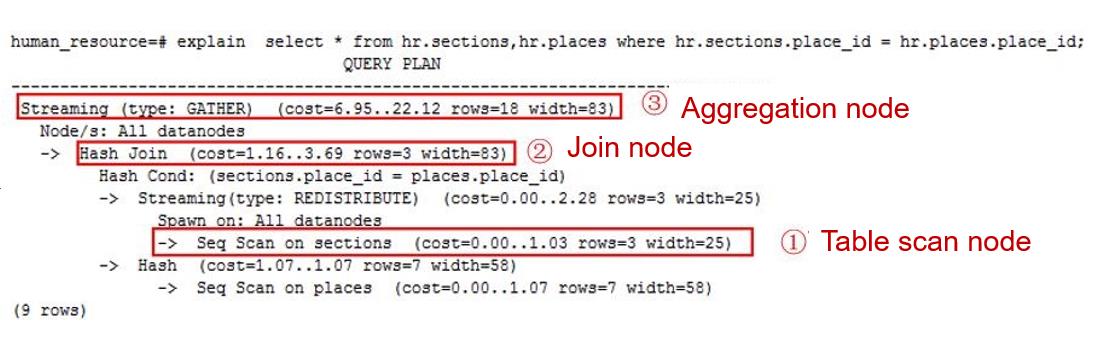
- The bottom-layer node is the table scan node, which scans the table and returns the original data rows. The types of scan nodes (sequential scans and index scans) vary depending on the table access methods. The scan object of the bottom-layer node may also be non-table row data (that is not directly read from the table), such as the VALUES clause and the function that returns a row set. They have their own scan node types.
- If a query requires joining, aggregation, sorting, or other operations on the original row, other nodes are added to the scan node. In addition, there is more than one way to perform these operations, so different types of execution nodes may be displayed.
- The first row (the upper-layer node) estimates the total execution cost of the execution plan. Such an estimate indicates the value that the optimizer tries to minimize.
Execution Plan Display Format
GaussDB provides four display formats: normal, pretty, summary, and run.
- normal indicates that the default printing format is used, as shown in Figure 1.
- pretty indicates a new format improved by using GaussDB. The new format contains a plan node ID, directly and effectively analyzing performance.
gaussdb=# explain select * from t1,t2 where t1.c1=t2.c2; id | operation | E-rows | E-width | E-costs ----+-----------------------------------------+--------+---------+--------- 1 | -> Streaming (type: GATHER) | 20 | 180 | 29.07 2 | -> Hash Join (3,5) | 20 | 180 | 27.75 3 | -> Streaming(type: REDISTRIBUTE) | 20 | 104 | 14.31 4 | -> Seq Scan on t2 | 20 | 104 | 13.13 5 | -> Hash | 21 | 76 | 13.13 6 | -> Seq Scan on t1 | 20 | 76 | 13.13 (6 rows) - summary indicates that analysis of the pretty printed information is added.
- run indicates that the system exports the printed information specified by summary as a CSV file for further analysis.
You can change the display formats of execution plans by configuring explain_perf_mode. Later examples use the pretty format by default.
Execution Plan Information
In addition to configuring different display formats for execution plans, you can use different EXPLAIN syntax to display execution plan information in detail. For details about how to use EXPLAIN, see EXPLAIN.
- EXPLAIN statement: only generates an execution plan and does not execute. The statement indicates SQL statements.
- EXPLAIN ANALYZE statement: generates and executes an execution plan, and displays the execution summary. Then actual execution time statistics are added, including the total elapsed time expended within each plan node (in milliseconds) and the total number of rows it actually returned.
- EXPLAIN PERFORMANCE statement: generates and executes an execution plan, and displays all execution information.
To measure the run time cost of each node in the execution plan, the current execution of EXPLAIN ANALYZE or EXPLAIN PERFORMANCE adds profiling overhead to query execution. For details, see EXPLAIN. Running EXPLAIN ANALYZE or PERFORMANCE on a query sometimes takes longer time than executing the query normally. The amount of overhead depends on the nature of the query, as well as the platform being used. For details, see "SQL Reference" > "SQL Syntax" > "EXPLAIN" in GaussDB Development Guide (1.x).
Therefore, if a SQL statement is not finished after being running for a long time, run the EXPLAIN statement to view the execution plan and then locate the fault. If the SQL statement has been properly executed, run the EXPLAIN ANALYZE or EXPLAIN PERFORMANCE statement to check the execution plan and information to locate the fault.
The EXPLAIN PERFORMANCE lightweight execution is consistent with EXPLAIN PERFORMANCE but greatly reduces the time spent on performance analysis.
Feedback
Was this page helpful?
Provide feedbackThank you very much for your feedback. We will continue working to improve the documentation.See the reply and handling status in My Cloud VOC.
For any further questions, feel free to contact us through the chatbot.
Chatbot


