Querying Details About a Professional Event Stream Job
This section describes how to query details about a professional event stream job on the console, including basic information, job management, monitoring metrics, and logs.
Viewing Basic Information
- Log in to the EG console.
- In the navigation pane, choose Event Streams > Professional Event Stream Jobs.
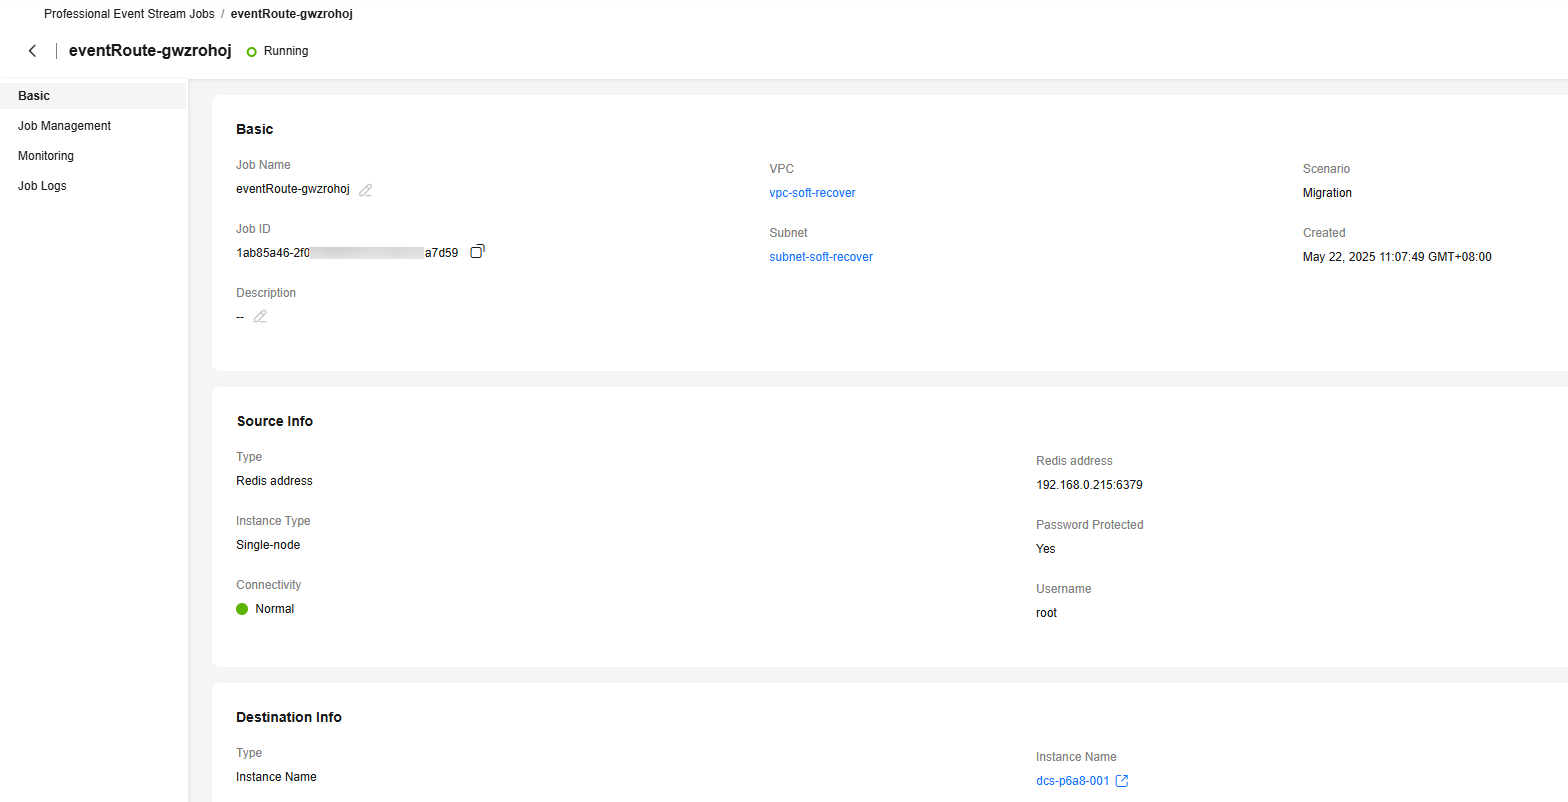
- Click the name of the event stream job to be queried. On the displayed page, view its basic information.
Figure 1 Basic information

Viewing Job Management
- Logging In to the EG Console.
- In the navigation pane, choose Event Streams > Professional Event Stream Jobs.
- Click the name of the event stream job to be queried.
- Click Job Management to view job information.
Figure 2 Job management

Viewing Monitoring Metrics
- Logging In to the EG Console.
- In the navigation pane, choose Event Streams > Professional Event Stream Jobs.
- Click the name of the event stream job to be queried.
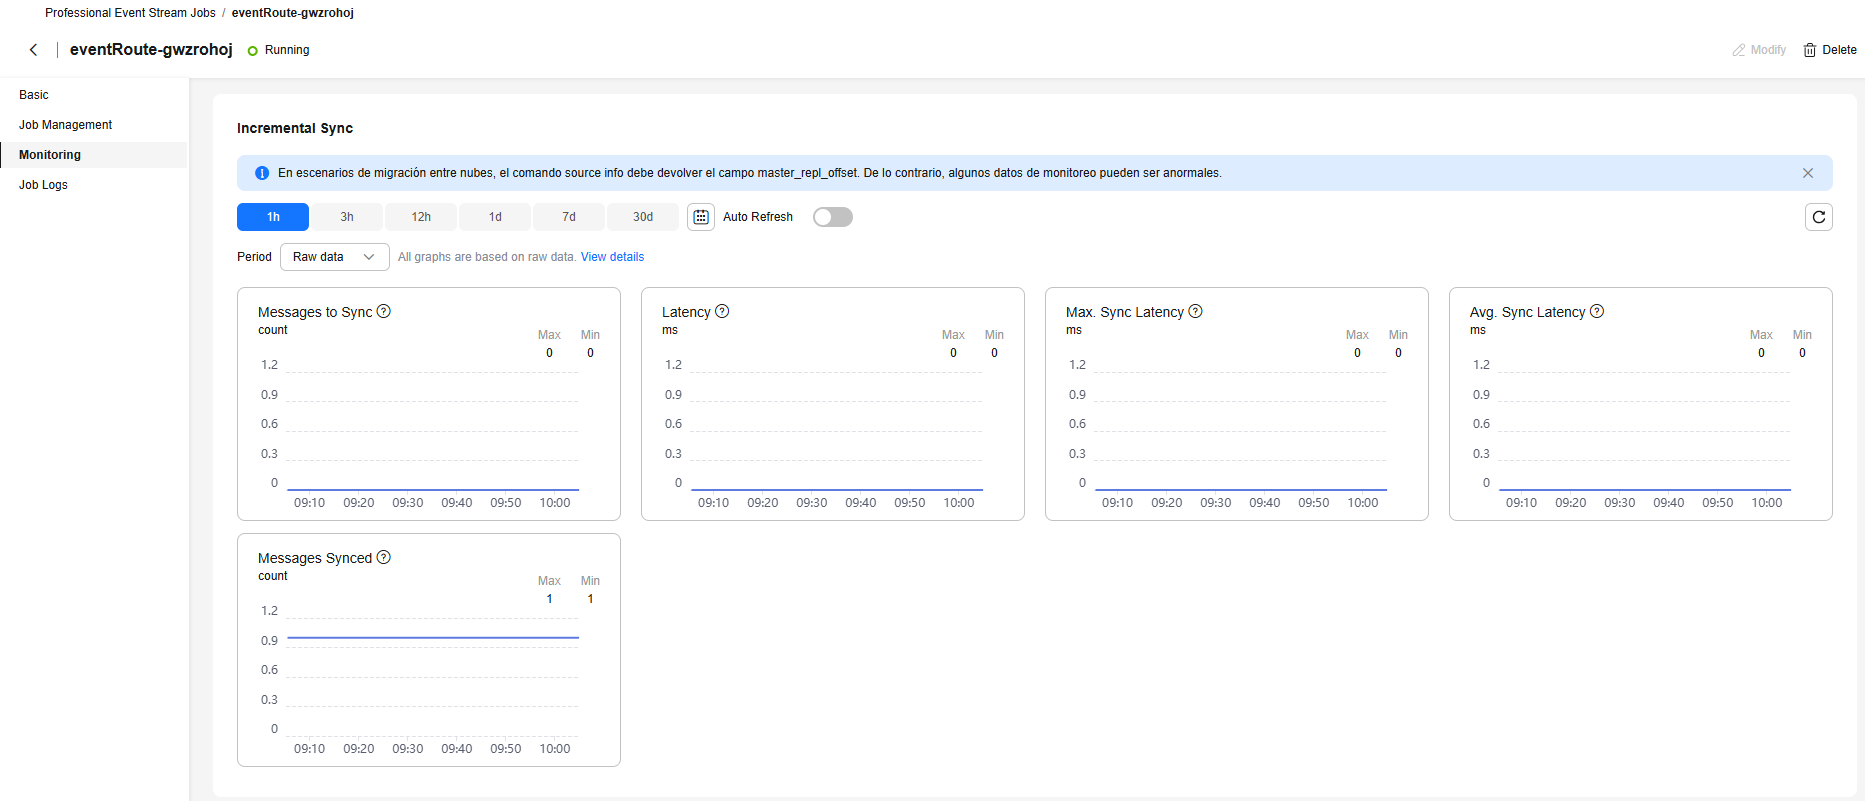
- Click Monitoring to view the monitoring information.
- Data of all delivered events in the last hour is displayed by default.
You can also click 1h, 3h, 12h, 1d, 7d, or 30d to view event deliveries in different periods.
Figure 3 Monitoring metrics

Currently, the metrics Messages to Sync and Messages Synced in DCS event stream job are calculated independently.
- Messages to Sync indicates the total write operations executed at source.
- Messages Synced which indicates the number of synchronized commands. Full RDB synchronization of existing source data credits only one synced message for the entire dataset transfer, potentially leaving Messages to Sync greater than Messages Synced after completion.

- The time range can be customized.
- If you enable Auto Refresh, the metric data is refreshed every 5 seconds.
- Click View details to go to the Cloud Eye console.
- If you set Period to Raw data, the raw monitoring data is displayed. If you set Period to a specific time, you can select different aggregation methods, including Avg., Max., Min., Sum, and Variance.
Viewing Job Logs
- Logging In to the EG Console.
- In the navigation pane, choose Event Streams > Professional Event Stream Jobs.
- Click the name of the event stream job to be queried.
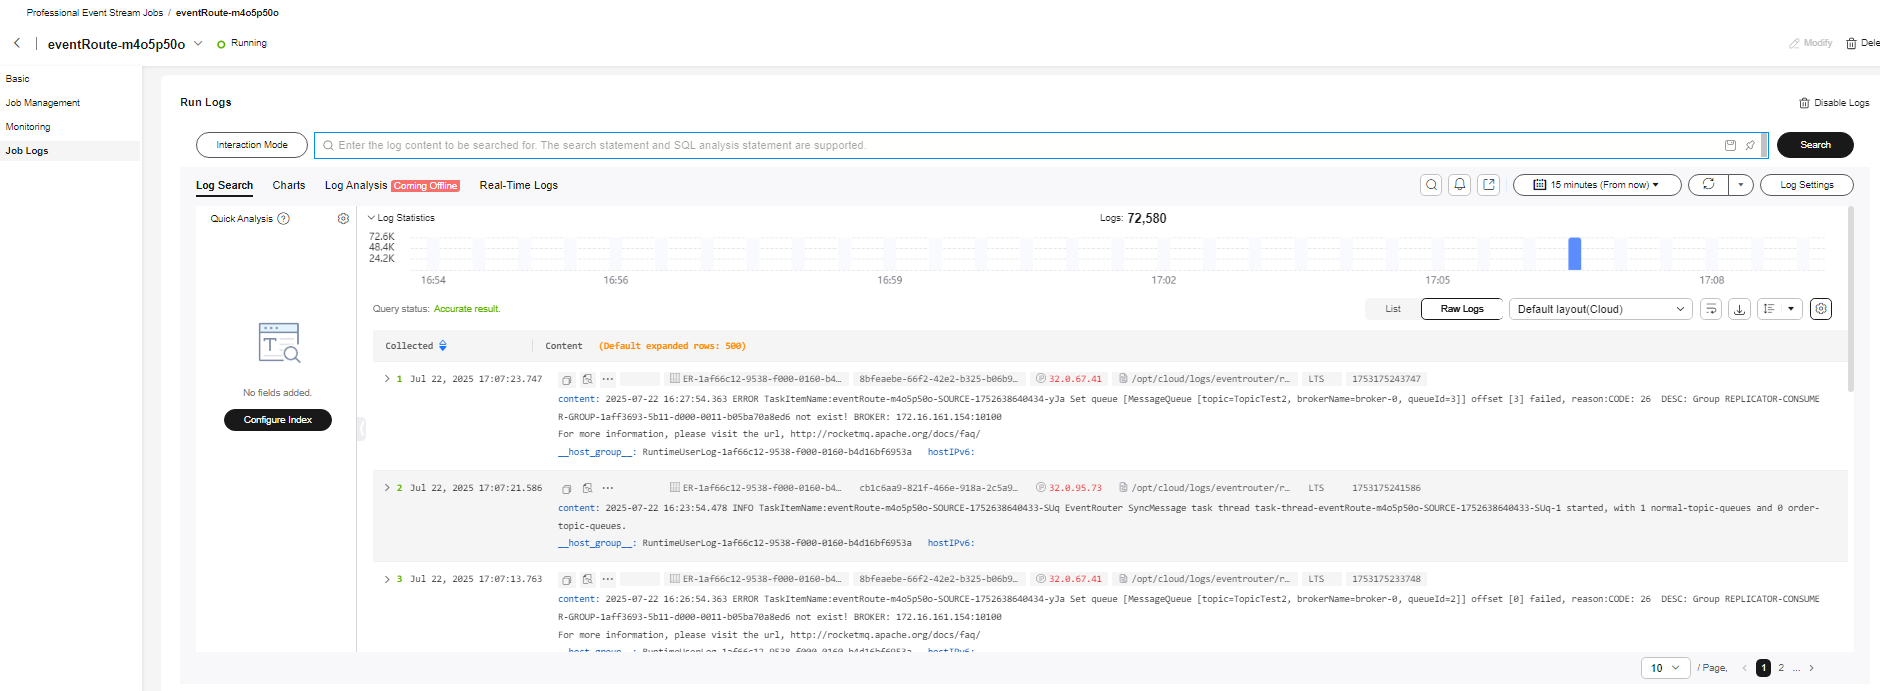
- Click Job Logs.
- If the log function is not enabled, click Enable Logs and toggle on Manually Configure Files.
- Select the existing log group and log stream, and click OK.

Before enabling logs, you need to enable the LTS service and create a log group and log stream. For details, see Log Management.
- View job logs.

Feedback
Was this page helpful?
Provide feedbackThank you very much for your feedback. We will continue working to improve the documentation.See the reply and handling status in My Cloud VOC.
For any further questions, feel free to contact us through the chatbot.
Chatbot


