
Help Center/
Edge Security/
User Guide/
Security Protection/
Protection Statistics/
Bot Request Distribution Statistics
Updated on 2025-09-15 GMT+08:00
Bot Request Distribution Statistics
On the Bot Distribution Statistics page, you can view the statistics of yesterday, today, past 3 days, past 7 days, past 30 days, or a custom period.
Procedure
- Log in to the EdgeSec console.
- In the navigation pane on the left, choose , and click the Bot Distribution Statistics tab.
- In the upper part of the Bot Request Distribution Statistics page, select an enterprise project, and set the domain name, website, and time range.
- All protected websites: By default, the information about all websites you add to EdgeSec in all enterprise projects are displayed.
- Time range: You can select Yesterday, Today, Past 3 Days, Past 7 Days, Past 30 Days, or Custom.
- Auto Refresh: After the function is enabled, the data is refreshed every 30 seconds.
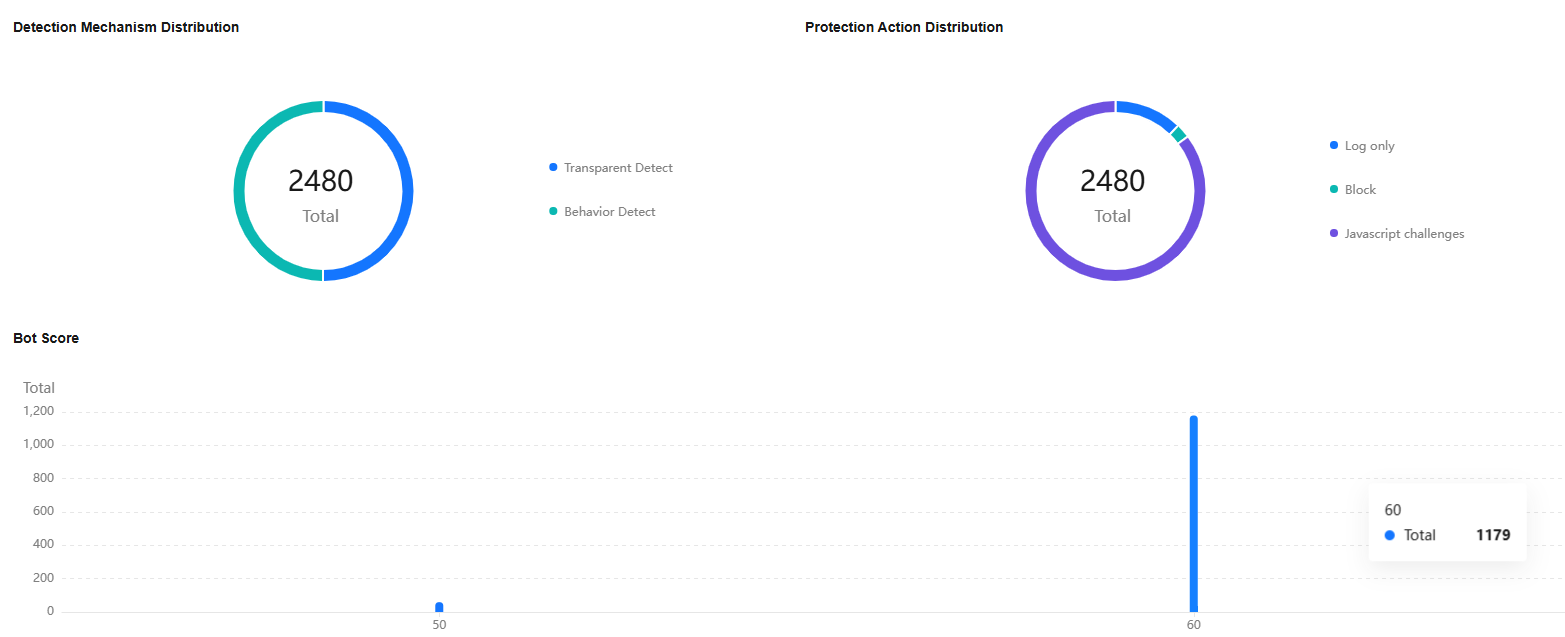
- View the Detection Mechanism Distribution chart and Protection Action Distribution charts. The Detection Mechanism Distribution chart compiles statistics on the number of requests from known bots, transparent detection, behavior detection, and human behavior. The protection actions in the Protection Action Distribution chart include Log only, Block, and Javascript challenges.
- View the Bot Score chart. The Bot Score bar chart displays each bar as a 10-point score segment: [0, 10), [10, 20), and so forth, with the final bar being [90, 100]. There are 10 bars in total. A higher score signifies a closer resemblance to bot behavior. For instance, the 50 score segment represents the total number of attack requests corresponding to all bot scores in the 50-60 (excluding 60) segment.
- View the displayed data.
Figure 1 Bot request distribution statistics
Feedback
Was this page helpful?
Provide feedbackThank you very much for your feedback. We will continue working to improve the documentation.See the reply and handling status in My Cloud VOC.
The system is busy. Please try again later.
For any further questions, feel free to contact us through the chatbot.
Chatbot


