
Viewing the Security Awareness Dashboard
There are always such scenarios as presentation, reporting, or real-time monitoring where you need to present the analysis results of DSC on large screens to achieve better demonstration effect. It is not ideal to just zoom in the console. Now, DSC Dashboard is a good choice for you to display the service console on bigger screens for a better visual effect.
By default, DSC provides an integrated situational awareness dashboard that presents a thorough analysis of risky assets, identification, masking, and watermarking tasks, as well as events and alarms in the cloud. This dashboard facilitates swift recognition and response to the overall status of assets, including addressing risky assets and urgent alarms.
Prerequisites
- Cloud asset access permissions are granted. For details, see Allowing or Disallowing Access to Cloud Assets.
- The DBSS service has been enabled. For details, see Purchasing Database Audit.
Procedure
- Log in to the DSC console.
- Click
 in the upper left corner and select a region or project.
 - In the navigation pane on the left, choose Data Security Operations > Dashboard. The Dashboard page is displayed.
- Click the Dashboard image. The Dashboard page is displayed.
This dashboard includes many graphs.
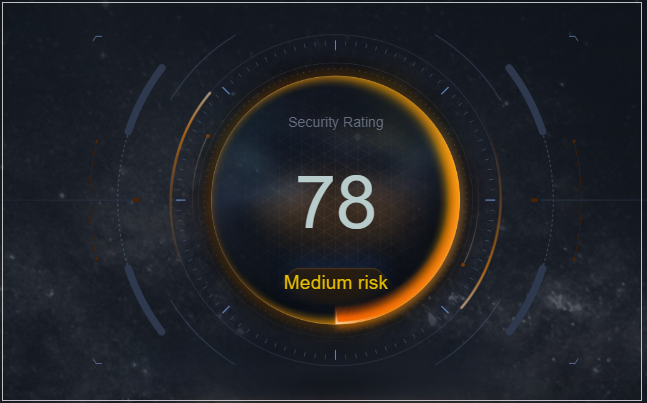
Security Score
The security scores of all assets are displayed, as shown in Figure 1.
|
Parameter |
Source |
Description |
|---|---|---|
|
Security Score |
Score on the asset map |
For details about the score calculation rules, see Security Score. The criteria for classifying high, medium, and low risks in the final score are as follows:
|
Risky Asset Statistics
Risky asset statistics come from the asset map. To view asset details, go to this page.
|
Parameter |
Source |
Description |
|---|---|---|
|
High/Medium/Low-risk assets |
Risk Level in the Protection Policy Analysis and Common Read/Write tab pages of the asset map. |
For details about the calculation rules, see Risk Statistics. |
|
Attacked assets |
Alarms in |
Analyze the number of attacked assets based on alarms in Alarm Management. |
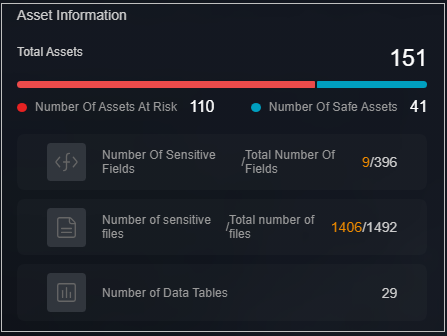
Information
The total number of assets and the identified high-, medium-, and low-risk assets are displayed, as shown in Figure 2.
|
Parameter |
Source |
Description |
|---|---|---|
|
Total assets |
Sum of high-risk, medium-risk, and low-risk assets. |
- |
|
Risky assets |
Sum of high- and medium-risk assets. |
- |
|
Secure assets |
Number of low-risk assets. |
- |
|
Sensitive fields/Total fields |
Sensitive data identification |
Total number of sensitive data fields/Total number of fields. |
|
Sensitive files/Total files |
Sensitive data identification |
Total number of sensitive data files in OBS assets/Total number of files. |
|
Data tables |
Total number of sensitive data tables. |
Total number of sensitive data tables. |
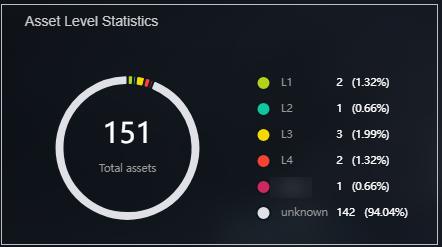
Asset Statistics by Level
The total number of assets that have been categorized and leveled through sensitive data identification, and the number and proportion of assets at each level are displayed, as shown in Figure 3.
|
Parameter |
Data Scope |
Description |
|---|---|---|
|
Total assets |
Asset map |
Total number of assets that are classified and graded using the sensitive data identification function. |
|
Level |
Sensitive data identification |
Number of assets at each level and the proportion of each asset to the total assets. |
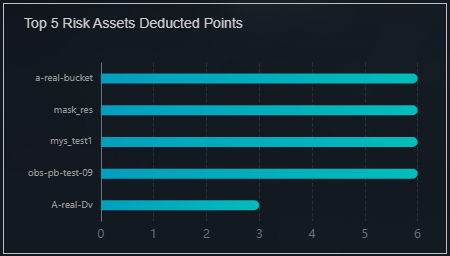
Top 5 Risky Assets with Highest Lost Scores
The top 5 assets with the highest lost scores are displayed. When you move the cursor to the bar chart, the asset name, asset type, data source, and score loss are displayed, as shown in Figure 4.
|
Parameter |
Source |
Description |
|---|---|---|
|
Risky asset score loss |
Asset map |
The asset name, asset type, data source, and score deduction of a single asset are displayed based on the sore loss rules in the asset scoring rules. The details about the score deduction rules are described on the console. For details, see Security Score. |
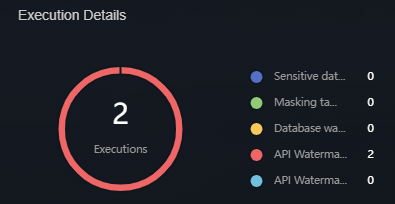
Execution Information
The total number of executed tasks is displayed, including sensitive data identification, static data masking, and data watermarking tasks are displayed, as shown in Figure 5.
|
Parameter |
Source |
Description |
|---|---|---|
|
Total executions |
Sensitive data identification, static data masking, database watermarking, API watermark injection, and API watermark extraction |
Total number of executed tasks. |
Handling Statistics
- Alarm Handling Statistics
Displays the total number of alarms and the number of unhandled alarms from the Alarm Management page by time.
- Event Handling Statistics
Displays the total number of events and the number of unhandled events from the Event Management page by time.
Table 7 Task execution information Parameter
Source
Description
Total alarms
Alarm Management module
Total number of alarms in the alarm list on the Alarm Management page
Unhandled alarms
Alarm Management
Number of alarms whose status is enabled in the alarm list on the Alarm Management page
Total events
Event Management module
Total number of events in the event list on the Event Management page
Unhandled events
Event Management module
Number of events whose status is enabled and blocked in the alarm management list.
Figure 6 Handling Statistics
Threat Trends
The number of database attacks are displayed by time.
|
Parameter |
Source |
Description |
|---|---|---|
|
Database attacks |
Alarm Management module |
Analyze the number of database attacks based on the alarms on the Alarm Management page. |
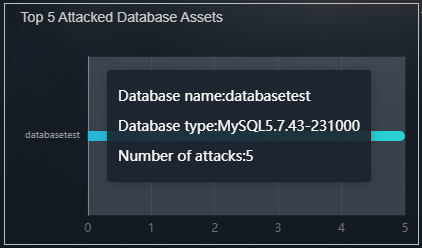
Top 5 Attack Targets
|
Parameter |
Source |
Description |
|---|---|---|
|
Top 5 attacked database assets |
Alarm Management module |
Analyze and display top 5 attacked database assets based on alarms on the Alarm Management page. |
Top 5 attacked database assets
The top 5 attacked database assets are displayed. When you move the cursor to the bar chart, the Database, Database type, and Number of attacks are displayed, as shown in Figure 7.
Feedback
Was this page helpful?
Provide feedbackThank you very much for your feedback. We will continue working to improve the documentation.See the reply and handling status in My Cloud VOC.
For any further questions, feel free to contact us through the chatbot.
Chatbot


