
Custom Map
This section describes the parameters of a custom map.
Fields
- In the Data area on the right, select a dataset, and double-click or drag required dimension and metric fields to the corresponding areas on the Fields tab.
- Set a filter.
- Find the data field you need in the dimension and metric lists within the data column.
- Click
 next to the field you wish to filter and you will be directed to the filter settings page.
 - Click OK.
Table 1 Filter parameters Type
Parameter
Description
string
Condition
Filter Mode: The options are Condition and Enumeration.
Condition Type: The options are And condition and Or condition.
Filter Condition: The options are Exact match, Contain, Start with, End with, Not match, Not contain, Null, and Not null.
Enumeration
Query Mode: The options are Single-select and multi-select.
Filter Condition: The options are >, ≥, <, ≤, =, ≠, Null, and Not null.
Metric
Condition Type
The options are And condition and Or condition.
Filter Condition
The options are >, ≥, <, ≤, =, ≠, Null, and Not null. You can select Before aggregation and After aggregation for data.
NOTE:If you select Before aggregation, data is filtered before aggregation. If you select After aggregation, data is filtered after aggregation. For aggregation concepts, see Creating a Dataset.
You can click Create Filter Condition to set multiple filter criteria.
Date
Range value
Select a time range for filtering.
Single value
Set a single time for filtering.
Condition
You can select And condition or Or condition as the condition type and select filter condition like >, ≥, <, ≤, and =.
You can click Create Filter Condition to set multiple filter criteria.
- Set the maximum number of query results.
Enter the maximum number of records that can be returned in the text box. The default value is 1000.
- Set automatic refresh.
The auto refresh interval supports the following options: no refresh, 1 minute, 5 minutes, 15 minutes, and 30 minutes.
Styles
This section describes parameters of a custom map.
- Size/Position
- W: width of the target, in pixels.
- H: height of the target, in pixels.
- X: position of the target on the canvas, in pixels.
- Y: position of the target on the canvas, in pixels.
- Opacity: Adjust the transparency of the target on the canvas using a slider or by manually entering a percentage. A higher percentage means lower transparency.
Figure 1 Size/Position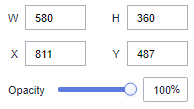
- Global Style
- Map Center: Set the position of the map center on the canvas.
- Top: Set the top of the map center. The value ranges from 0 to 200.
- Left: Set the left of the map center. The value ranges from 0 to 200.
- Zoom Range: Set the zoom ratio of the map center in the layer. The value ranges from 0.1 to 50.
- Boundary Data Source: Set the source of the map data. The options are Link and Materials.
- Link: Copy a link to the URL Address text box to obtain boundary data.
- Materials: Select or upload your own JSON file to obtain boundary data.
Figure 2 Global Style
- Map Center: Set the position of the map center on the canvas.
- Filling Settings
- Transparency: Set the filling transparency. The value ranges from 0 to 1.
- Borderline Options: Set the color and width of the borderline.
- Color: Set the filling color.
- Width: Set the filling width. The value ranges from 0 to 10.
Figure 3 Filling Settings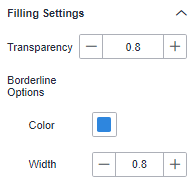
- Visual Mapping
- ShowVisual Mapping: Select or deselect the check box to show or hide virtual mapping.
- Direction: Select a mapping direction from the drop-down list. The value can be Vertical or Horizontal.
- Mapping Type: Select a mapping type. The value can be Continuous or Custom range.
- Width: Set the width of the visual mapping.
- Height: Set the height of the visual mapping.
- Left: Set the distance between the visual mapping and the left side of the layer.
- Bottom: Set the distance between the visual mapping and the bottom of the layer.
- Spacing: Set the spacing between mappings.
- Text: Set the font color and font size of the text in the visual mapping.
- Mapping Type: The value can be Continuous or Custom range. You can set the value range, color, and text.
- Out of Range: Set the color for the mapping out of the range.
Figure 4 Visual Mapping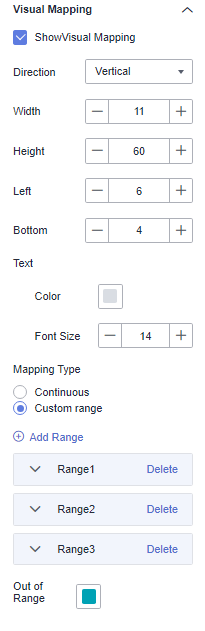
- Label
- ShowLabel: Select or deselect the check box to show or hide labels for the map.
- Show all: After this option is selected, all labels are displayed.
- Show metrics: Select this option to show the metrics specified in Fields.
- Font: Set the font of the labels.
- Color: Set the color of the labels.
- Font Size: Set the font size of the labels. The value ranges from 10 to 100.
- Font Weight: Set the font weight of the labels. The options are Normal, Bold, Bolder, and Lighter.
- Selected Style
- Color: Click the color editor to set the color.
- Data Value: Select or deselect the check box to show or hide the data value.
- Data Name: Select or deselect the check box to show or hide the data name.
- Text Style: Set the text color, font size, and font weight.
- Padding: Set the padding of the tooltip. The value cannot be smaller than 0.
- Background Color: Set the background color of the tooltip.
- Custom Size: Set the size of the tooltip.
- Border Color: Set the border color of the tooltip.
- Border Width: Set the border width of the tooltip. The value cannot be smaller than 0.
Figure 5 Selected Style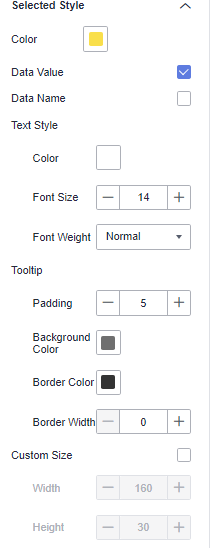
- ShowZoom Settings: Set whether to enable zoom.
- ShowPanning Settings: Set whether to enable panning.
Interactions
- Link
On the Interactions tab, choose Advanced > Link. In the Chart Linkage Configuration dialog box that appears, set parameters by referring to Table 2. For details, see Example linkage.
- Filter
- Click Filter. The Filter tab is displayed.
- Click
 next to Fields to Bound. The associated field box is displayed.
 - Click
 , select the field to be bound, select the associated chart, and click OK.
- Shown/Hidden
- Click Show/Hidden. The Shown/Hidden tab is displayed.
- Select the associated chart and click OK.
Table 2 Chart linkage configuration parameters Parameter
Description
Filter
- Fields to Bound: Select the fields to be bound.
- Associated Charts: Set linked associated charts. You can select charts from the same dataset or different datasets.
Shown/Hidden
Select the required fields first and then select the charts to be associated with them. You can select all charts on the large screen.
- Click Show/Hidden. The Shown/Hidden tab is displayed.
- Select the associated chart.
- Filter
Scenario: Creating a Map of Jiangsu Province
- Prerequisites
- A project has been created.
- A data source has been created.
- A dataset has been created.
- A screen has been created.
- Procedure
- Log in to the DataArts Insight management console.
- Click the project name to access the project.
- Click Create and select Create Screen.
- Click the Maps icon in the navigation pane and click Custom Map. Choose Styles > Global Style and set Boundary Data Source.
Click Link and enter a link in URL Address. The map of Jiangsu province is displayed.
Figure 6 Link
- Select ShowLabel. The labels of each city are displayed on the map.
- Set the visual mapping and preview the GDP distribution of each city in Jiangsu province.
- Select the new dataset.
- Set the fields (Geographical Location/Dimension to City and Numeric/Metric to GDP) and click Update.
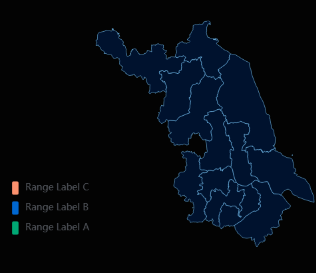
- Set the mapping range (custom range). Then, different colors are displayed on the map to distinguish the GDP distribution of each city in Jiangsu province. For details, see Figure 7.
Figure 8 Setting the value range

Feedback
Was this page helpful?
Provide feedbackThank you very much for your feedback. We will continue working to improve the documentation.See the reply and handling status in My Cloud VOC.
For any further questions, feel free to contact us through the chatbot.
Chatbot


