
Text
This section describes the parameters of a text component.
Fields
- Manual input: Enter a text in the Text Content text box.
- Dynamic fields
In the category axis/dimension and axis value/metric lists, select fields and drag and drop them to the Text Settings/Dimensions or Metrics area.
The Fields tab also offers the following parameters to help you analyze data:
- Set the field display content (Category Axis/Dimension).
Click
 in the column, select Field Display Content and click to modify the field display content on the displayed page. Click OK.
 - Set the aggregation mode (Axis Value/Metric).
Click
 of the field in the column and select an aggregation mode. No aggregation, sum, count, distinct count, maximum value, minimum value, average value, population standard deviation, sample standard deviation, and sample variance are supported.
 - Filter: If you have a large amount of data, you can enable the filter function to filter out the required data categories from the dataset. Filters can filter character, numeric, and date data.
Filter Settings: Click
 next to the field you wish to filter and you will be directed to the filter settings page.
- Filter field selection dimension
- Non-time fields
Table 1 Filter parameters Parameter
Description
Dataset
The dataset selected for constructing the large screen component.
Selected Field
The fields selected for filtering (non-time fields).
Filter Mode
When the selected field is a dimension, filtering can be done by condition or enumeration.
Condition Type
When the selected field is a dimension and filtering is done by condition, both AND and OR conditions are supported.
When the selected field is a dimension and filtering is done by enumeration, single or multiple selections are supported.
Filter Criteria
When the selected field is a dimension and filtering is done by condition, the following conditions can be set: exact match, contains, starts with, does not match, does not contain, is empty, is not empty, etc.
When the selected field is a dimension and filtering is done by enumeration, the corresponding field can be selected.
- Time fields
Table 2 Filter parameters Parameter
Description
Dataset
The dataset selected for constructing the large screen component.
Selected Field
The fields selected for filtering (time fields).
Filter Mode
When the selected field is a dimension, filtering can be done by single value, range value, or condition.
Filter Criteria
When the selected field is a dimension and filtering is done by single value or range value, the filtering conditions support both absolute and relative time.
When the selected field is a dimension and filtering is done by condition, both AND and OR conditions are supported.
- Non-time fields
- Filter field selection metric
Table 3 Filter parameters Parameter
Description
Dataset
The dataset selected for constructing the large screen component.
Selected Field
Select the fields to be filtered.
Condition Type
When the selected field is a metric and filtering is done by condition, both AND and OR conditions are supported.
Filter Criteria
When the field to be set is a metric, filtering conditions support settings such as >, ≥, <, ≤, =, ≠, is empty, is not empty, etc. It also supports settings before and after data aggregation.
- Filter field selection dimension
- Sorting: Sorts the dragged class axis/dimension fields in ascending or descending order.
Sorting settings: Click
 of the sorting field and choose the desired order.
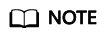
- Sorting by dimension: Drag and drop dimension fields into the sorting slots to display them in the chart.
- Sorting by metric: Metric fields in the sorting slots are not displayed in the chart by default. To display them, drag and drop them into the metric slots.
- Set Maximum Query Results. The value ranges from 1 to 5000.
- Auto Update: Set the time for data refresh, which can be 1 minute, 5 minutes, 15 minutes, 30 minutes, or Not update.
- Click Update to automatically update the chart.
- Set the field display content (Category Axis/Dimension).
Styles
- Size/Position
- W: width of the target, in pixels.
- H: height of the target, in pixels.
- X: position of the target on the canvas, in pixels.
- Y: position of the target on the canvas, in pixels.
- Opacity: Adjust the transparency of the target on the canvas using a slider or by manually entering a percentage. A higher percentage means lower transparency.
Figure 1 Size/Position
- Global Style
- Overflow Scrolling: Once selected, the system plays the text in rotation if the text overflows.
- Scrolling Time: Enter a value or click the buttons to set the text scrolling duration. Scrolling Time is available only when Overflow Scrolling is selected.
- Text style
- Delimiter: Set the text separator.
- Font: Select a font.
- Font Size: Set the font size.
- Text Spacing: Set the spacing of the text in the title.
- Color: Select a font color.
- Font Weight: Set the font width of the title text.
- Alignment: Select the alignment mode of the title text. The value can be Center Horizontally, Left, or Right.
- Align Top and Bottom: Select the alignment mode of the title text. The value can be Center, Align Top, or Align Bottom.
- Row Height: Enter a value to adjust the spacing between lines in the text.
- First Line Indentation: Enter a value to adjust the first line indent of the text.
- Value Settings: You can set the context, units, scientific notation, use of thousand separators, and decimal places for numerical values.
Interactions
- Interaction Definition
- Click Interactions.
- Expand Interaction Definition and click Edit interaction event.
Figure 2 Edit interaction page

- Set Event to Click.
- Click Add Action to add an action. Actions can be changed between hidden and visible states, with different action values displayed depending on the selected widget.
- Click OK to complete the setting of the interaction event.
- Data filtering operators are categorized by string, number, and date types.
- String operators support exact matches, inequalities, inclusions, exclusions, prefixes, suffixes, and checks for emptiness.
- Number operators allow for equality, inequality, range comparisons, and checks for emptiness.
- Date operators support equality and range comparisons.
- Interactions support the use of SQL placeholders to bind datasets dynamically.
- To enable global parameter effects, edit the SQL statements within the associated dataset and add dynamic parameters.
- Go to the component editing page and click Interactions to set related parameters.
- You can modify global parameters during interaction. During each interaction, global parameters are modified first, and then data associated with components is requested based on the global parameter values.
- To associate a target, you need to set global parameters. Click
 in the upper right corner of the large screen to set global parameters.
 - After setting global parameters, edit the interaction in the title or text component. You can select global parameters for the target component.
- To associate a target, you need to set global parameters. Click
- Data filtering operators are categorized by string, number, and date types.
- Advanced (Redirect)
- Click Interactions.
- Under Advanced, click
 next to Redirect. The chart redirection page is displayed.
 - Set Redirect Type, Open Mode, Redirect to Reports/Screens, and Associated Parameters, and click OK. For an example, see Redirection with Parameters.
Table 4 Parameters Parameter
Description
Redirect Type
Intra-system redirect: Redirect to the internal screen and dashboard projects.
External redirect: Redirect to a link that is not in the software.
Open Mode
Open in this window: After you click the chart with redirection set, the target chart is opened in the current window.
Open in new window: After you click the chart with redirection set, the target chart is opened in a new window.
Open in popup window: After you click the chart with redirection set, the target chart is opened as a pop-up window. The size of the pop-up window is customizable.
Redirect to Reports/Screens
- Select a project first.
- Select a dashboard/screen.
NOTE:
This step is mandatory when Redirect Type is set to Intra-system redirect.
Associated Parameters
Set Effective Parameters of This Screen.
- Associated Parameters: Carry associated fields to the chart that you are redirecting to.
- Enter a fixed value: The chart that you redirect to only filters the fixed value. For example, if the fixed value is set to city, the chart that you redirect to displays the filtered city field.
- Control Variables: Each value selected in the drop-down box, search, or tab list is a variable value set by the control variable. For example, if you select city in the drop-down box, the variable value of the control variable is city, and the chart that you redirect to filters out the city field.
- Global Parameters: Carry the values in the global variables to the chart that you redirect to.
Carry condition
When Redirect Type is Intra-system redirect, null values can be carried. Carrying null values is mainly used for filtering null values in data tables, making it easier for users to analyze data.
- Prerequisites: Set up two large screens, A and B, with screen A linking to screen B.
- Procedure
- Configure global parameters in screen B and ensure that the same fields exist in screen A.
- Set the redirect parameters in screen A, select screen B as the target, and choose associated fields from the global parameters.
- Select Carry null value and click OK.
- The bound field in screen A will be underlined. Click it to redirect to screen B and filter out rows with null fields. The URL of screen B will display the param parameter.
- Deselect Carry null value and click OK.
- The bound field in screen A will be underlined. Click it to redirect to screen B and display all chart data. The URL of screen B will not display the param parameter.
Feedback
Was this page helpful?
Provide feedbackThank you very much for your feedback. We will continue working to improve the documentation.See the reply and handling status in My Cloud VOC.
For any further questions, feel free to contact us through the chatbot.
Chatbot


