Dashboard Overview
A dashboard is a powerful tool for real-time data visualization, enabling you to collect complex data from various sources and convert it into easily comprehensible charts. You can interact with the data through clicking, filtering, and other actions to delve deeper into the analysis. Dashboards are ideal for both individuals and teams in daily tasks such as business monitoring, data analysis, and decision support. They help you quickly understand business trends and make more informed decisions.
Notes and Constraints
You have the permission to use required datasets.
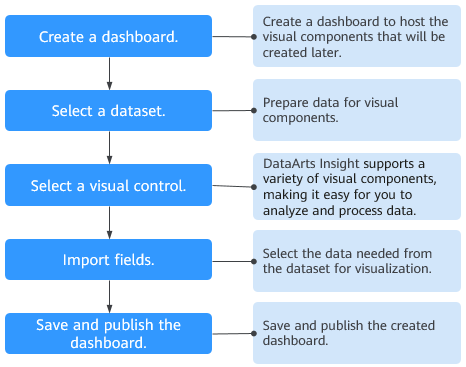
Creation Process

Feedback
Was this page helpful?
Provide feedbackThank you very much for your feedback. We will continue working to improve the documentation.See the reply and handling status in My Cloud VOC.
For any further questions, feel free to contact us through the chatbot.
Chatbot


