
Performance
The Real-Time Performance tab displays key performance metrics and allows you to compare metrics by date, so you can see the changes and identify exceptions in a timely manner.
Procedure
- Log in to the console.
- Click
 in the upper left corner and select a region and project.
 - Click
 in the upper left corner, and under Databases, click Data Admin Service.
 - In the navigation pane, choose Intelligent O&M > Instance List.
Alternatively, on the Overview page, click Go to Intelligent O&M.
- In the upper right corner of the Instance List page, search for instances by engine type, instance name, or instance IP.
- Locate the target instance and click Details.
- On the Performance tab page, perform the following operations:
- Enable monitoring by seconds.
- Specifying metrics
You can check metrics and specify metrics to create charts.
Figure 2 Specifying metrics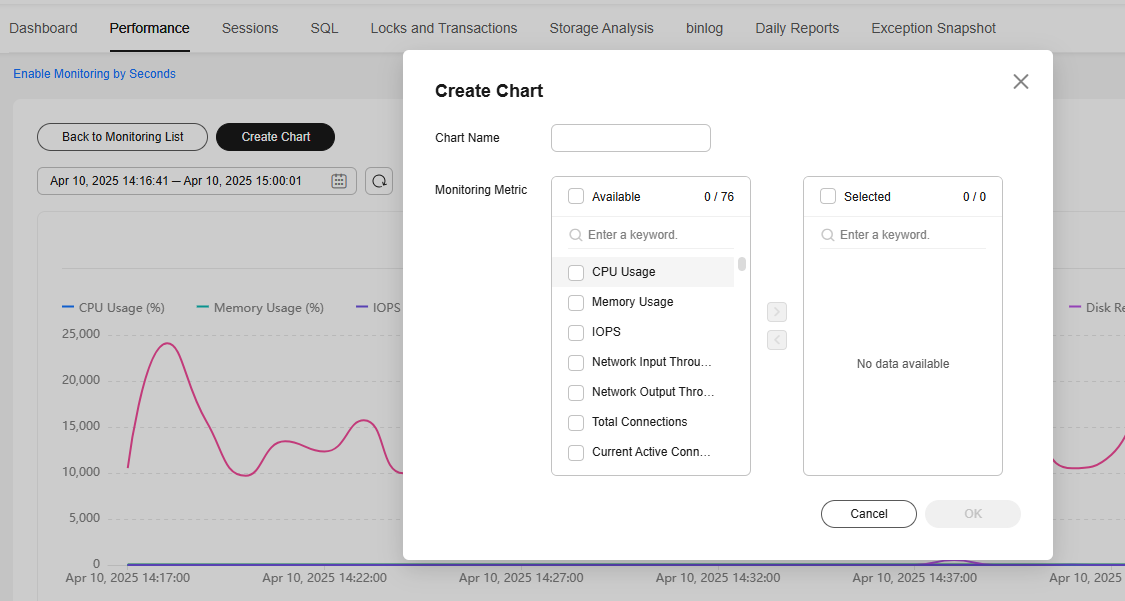
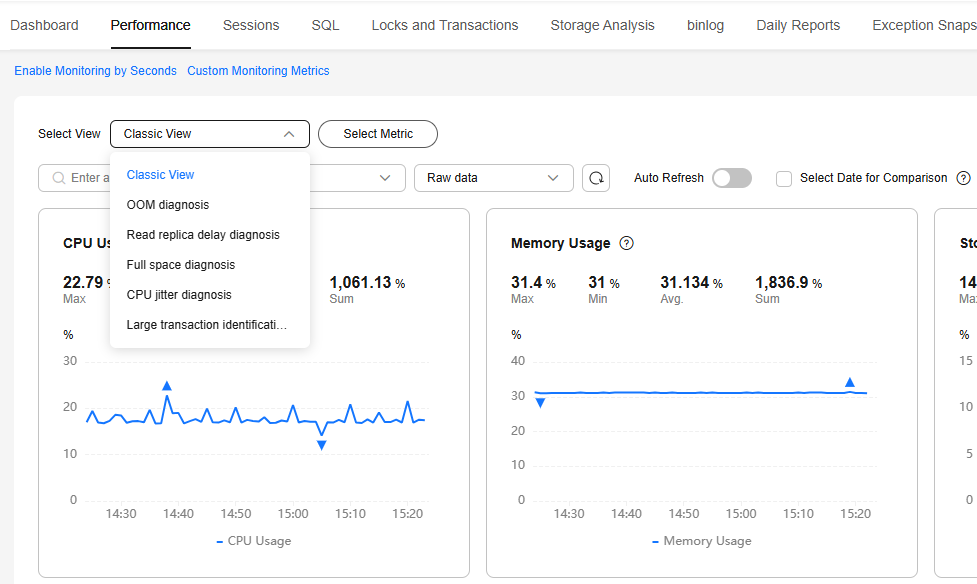
- You can select the classic, OOM diagnosis, read replica delay diagnosis, full space diagnosis, CPU jitter diagnosis, and large transaction identification and diagnosis views. Each view corresponds to a batch of preset metrics, which can help you diagnose DB instance problems.
Figure 3 Querying metrics by view
- View the trends in metrics in the same time range on different days.
You can select Select Date for Comparison, and specify the target comparison date and metrics to view trends in the metrics at the same time on different days.
You can place the pointer over a time point in the trend chart to view the metric at the time point on different days.Figure 4 Performance comparison
- View real-time performance of the instance.
You can deselect Select Date for Comparison, set a time range or select 1h, 3h, or 12h to view real-time metrics of the instance.
You can place the pointer over a time point in the trend chart to view the metric at this time point.Figure 5 Viewing performance metrics
- Customize the time range you wish to view.


Feedback
Was this page helpful?
Provide feedbackThank you very much for your feedback. We will continue working to improve the documentation.See the reply and handling status in My Cloud VOC.
For any further questions, feel free to contact us through the chatbot.
Chatbot


