Synchronizing OpenSearch Alerts to Prometheus
Make necessary configurations in OpenSearch Dashboards to synchronize OpenSearch alerts to Prometheus so you can use Prometheus to monitor and analyze key performance metrics for OpenSearch clusters in real time.
Prometheus is an open-source monitoring system with a dimensional data model, flexible query language, efficient time series database and modern alerting approach.
Constraints
Only OpenSearch 2.19.0 clusters support alarm synchronization to Prometheus.
Prerequisites
- The Prometheus monitor server is ready, and the Pushgateway address has been obtained. Prometheus and OpenSearch must be connected. Otherwise, alerts cannot be sent.
- The target OpenSearch cluster is available.
Configuring Alert Synchronization
- Log in to the CSS management console.
- In the navigation pane on the left, choose Clusters > OpenSearch.
- In the cluster list, find the target cluster, and click Dashboards in the Operation column to log in to OpenSearch Dashboards.
- On the OpenSearch Dashboards page, expand the menu in the upper-left corner, and choose Management > Notifications.
- Create a Prometheus channel to send alert messages.
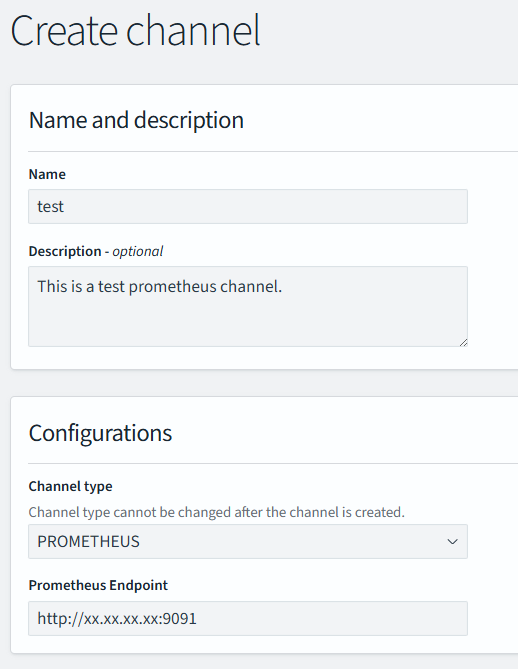
- On the Channels page, click Create channel to configure a channel.
Table 1 Channel parameters Parameter
Description
Name
Custom channel name.
Description
Channel description.
Channel type
Select PROMETHEUS.
Prometheus Endpoint
Enter the Pushgateway address of the Prometheus monitor server.
- Currently, only Prometheus Gauge dashboards can be added or deleted. Metrics are queried using specific statements and numeric values are synchronized to Pushgateway for monitoring via Prometheus.
- Two types of Pushgateway addresses are supported: HTTP and HTTPS.
Figure 1 Create channel
- Click Create.
- Return to the Channels page. If the newly created Prometheus channel is displayed, it has been created successfully. Figure 2 Channels list

- On the Channels page, click Create channel to configure a channel.
- On the OpenSearch Dashboards console, expand the menu in the upper-left corner, and choose Alerting.
- Create a monitor and configure alarm triggers and monitoring frequency.
- Click the Monitors tab on the Alerting page, and click Create monitors to configure monitor information.
Table 2 Monitor parameters Parameter
Description
Monitor details
Monitor name
User-defined monitor name
Monitor type
Monitor type, which can be:
- Per query monitor
- Per bucket monitor
- Per cluster metrics monitor
- Per document monitors
- Composite monitors
In this example, Per query monitor is selected. For more information, see Monitors in the OpenSearch official documentation.
Monitor defining method
Monitor defining method. Extraction query editor is recommended.
- Visual editor
- Extraction query editor
- Anomaly detector
The options of Monitor defining method are determined by the Monitor type you selected.
Detector
If Monitor defining method is set to Anomaly detector, select an exception detection task.
Frequency
Select the monitoring frequency and set the monitoring interval. The options include:
- By interval
- Daily
- Weekly
- Monthly
- Custom cron expression
Select data
Index
When Monitor defining method is set to Visual editor or Extraction query editor, you need to specify the index to be monitored.
Time field
When Monitor defining method is set to Visual editor, you need to specify the time field to define counting parameters such as count.
Query
Metrics
When Monitor defining method is set to Visual editor, you need to set the metrics range for extracting statistics.
Time range for the last
When Monitor defining method is set to Visual editor, you need to set the monitoring time range for plugins.
Data filter
When Monitor defining method is set to Visual editor, you need to set filters for data search.
Group by
When Monitor defining method is set to Visual editor, you need to specify a field so that each value of the field triggers an alarm.
Define extraction query
When Monitor defining method is set to Extraction query editor, you need to enter the query statement to define the monitoring.
Request type
When Monitor type is set to Per cluster metrics monitor, you need to specify the request type to monitor cluster metrics, such as the running status and CPU usage.
Preview query and performance
Preview the query result and verify query performance under the current configuration.
- Click Create. The Create trigger page is displayed.
- On the Create trigger page, set the alert triggering conditions and the actions to be triggered.
Table 3 Trigger parameters Parameter
Description
Define trigger
Trigger name
User-defined trigger name.
Severity level
Sensitivity of a trigger, that is, the number of alarms that need to be triggered before an alarm message is sent. 1 indicates the highest sensitivity.
Trigger condition
Trigger condition. An alarm is triggered when the trigger condition is hit.
NOTE:You are advised to set a trigger condition that can almost always be triggered so that the queried metrics will always be synchronized to the Pushgateway.
Configure actions
Action name
Trigger action name.
Destination
Select the destination created in 5.
Message
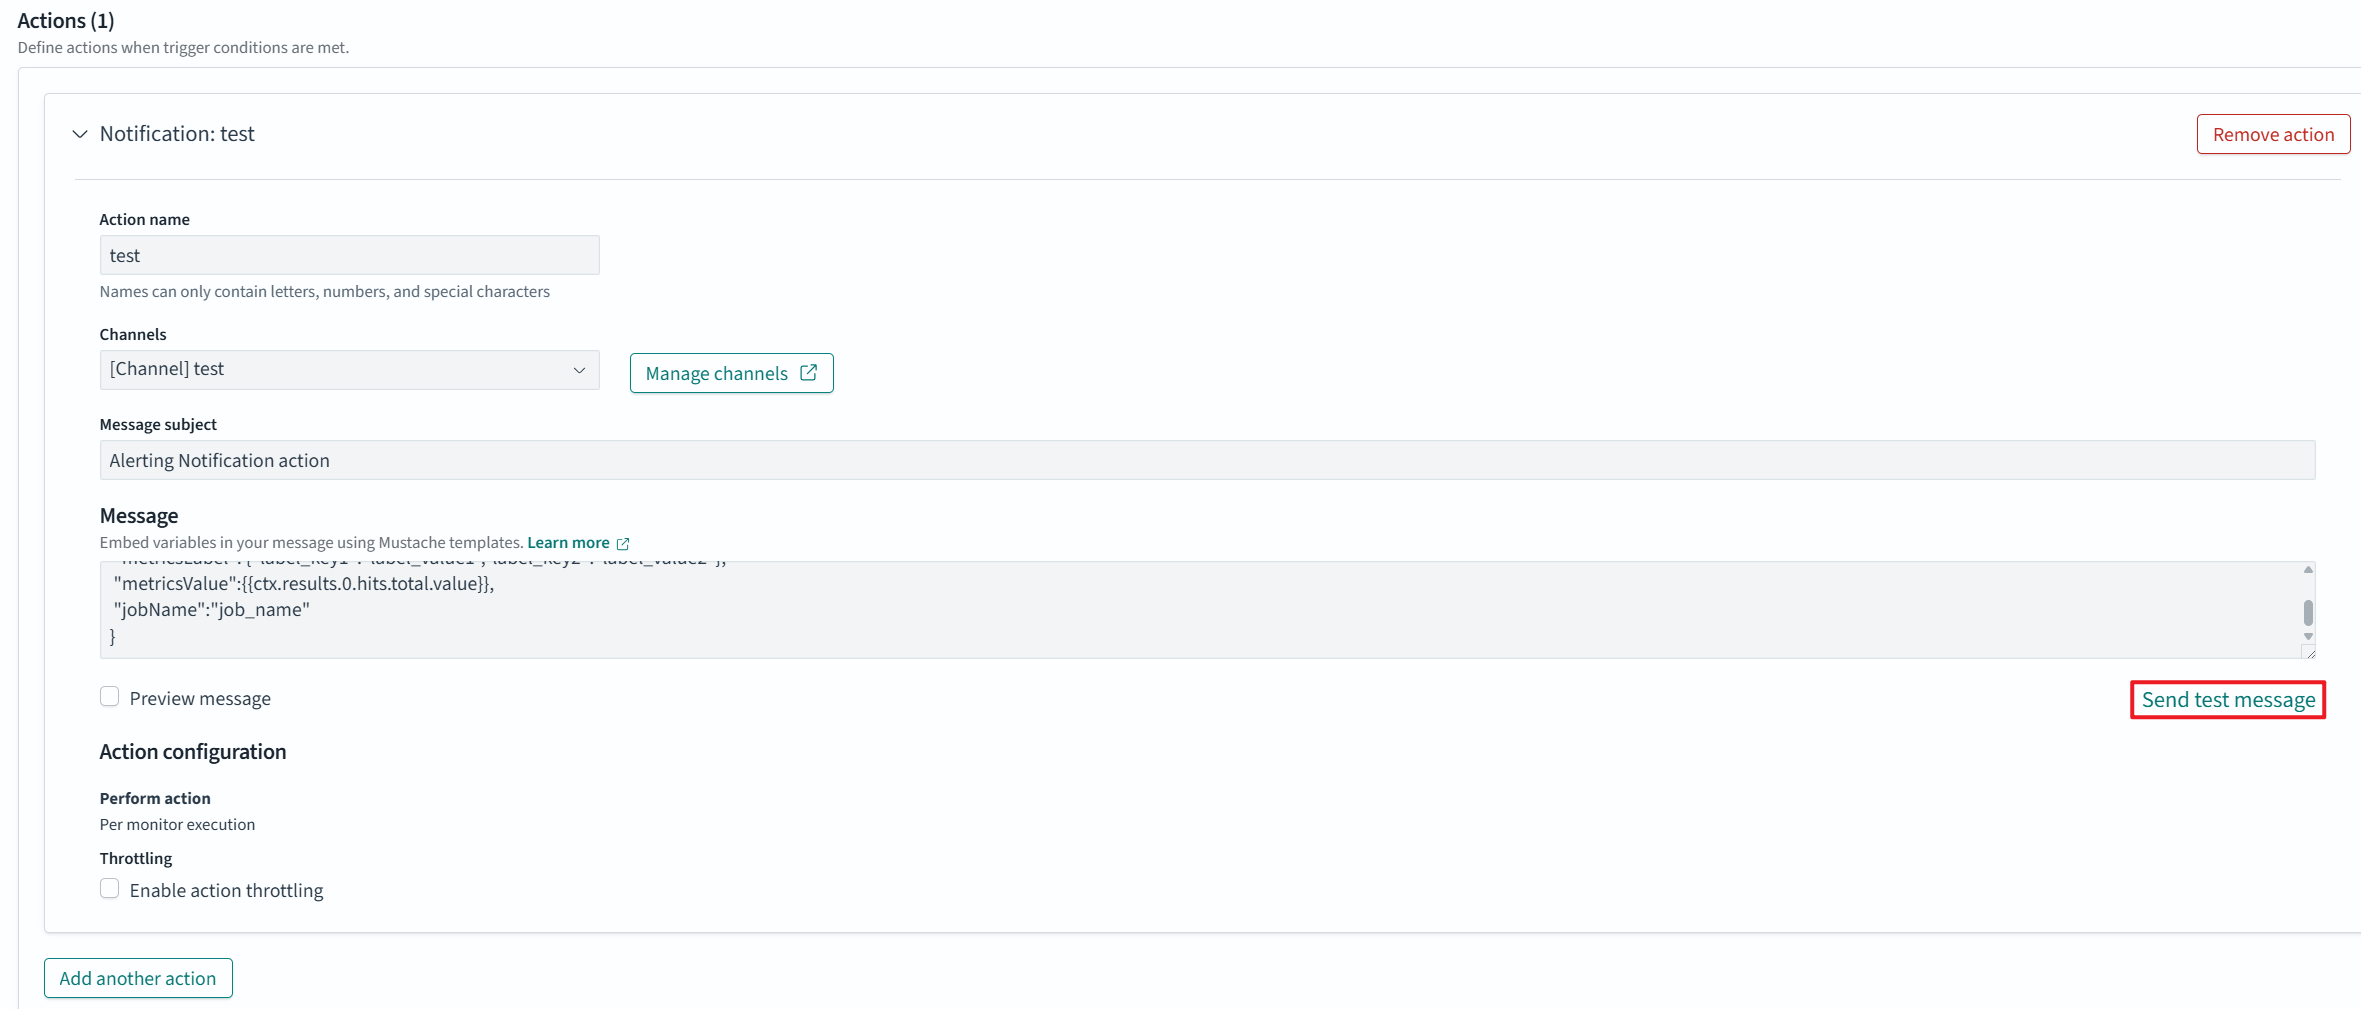
Defines the body of the message to be published, which must use the JSON format. See the following for an example.
{
 "metricsName":"hits_total_value", //Prometheus metric name
 "metricsLabel": {"label_key1":"label_value1","label_key2":"label_value2"}, //Prometheus labels
 "metricsValue":{{ctx.results.0.hits.total.value}}, //Prometheus metric values
 "jobName":"job_name" //Prometheus monitor task name
"metricsHelp":"***" //Metric explanation. Optional.
}
throttling
Message sending frequency. It limits the number of notification messages can be received in a specified period.
For example, if this parameter is set to 10 minutes, Prometheus sends only one alert notification in the next 10 minutes even if the trigger condition is met multiple times. After 10 minutes, Prometheus sends another alert notification if the trigger condition is met again.
- Click Send test message to send a test message to Prometheus to check whether the trigger is set successfully. Figure 3 Send a test message.

As shown in Figure 4, Prometheus can receive a triggered message, meaning the trigger is set successfully.
- Click Create to return to the Monitor details page.
- Click the Monitors tab on the Alerting page, and click Create monitors to configure monitor information.
Feedback
Was this page helpful?
Provide feedbackThank you very much for your feedback. We will continue working to improve the documentation.See the reply and handling status in My Cloud VOC.
For any further questions, feel free to contact us through the chatbot.
Chatbot


