Setting Doris Cluster Alarm Rules
To monitor the usage of cloud service resources or key operations on them, you can create an alarm rule. After an alarm rule is created, if a metric reaches the specified threshold or there is a specified event, Cloud Eye immediately informs you of the exception through Simple Message Notification (SMN).
You can set CloudTable Doris alarm rules to customize the monitored objects and notification policies. Then, you can learn about Doris running status in a timely manner. The Doris alarm rules include alarm rule name, instance, metric, threshold, monitoring interval and whether to send notification. This section describes how to set alarm rules.
Setting a Doris Cluster Alarm Rule
- Log in to the CloudTable console.
- In the navigation pane, choose Alarm Management > Alarm Rules.
- In the Resource Type column, select CloudTable Service to filter alarm rules.
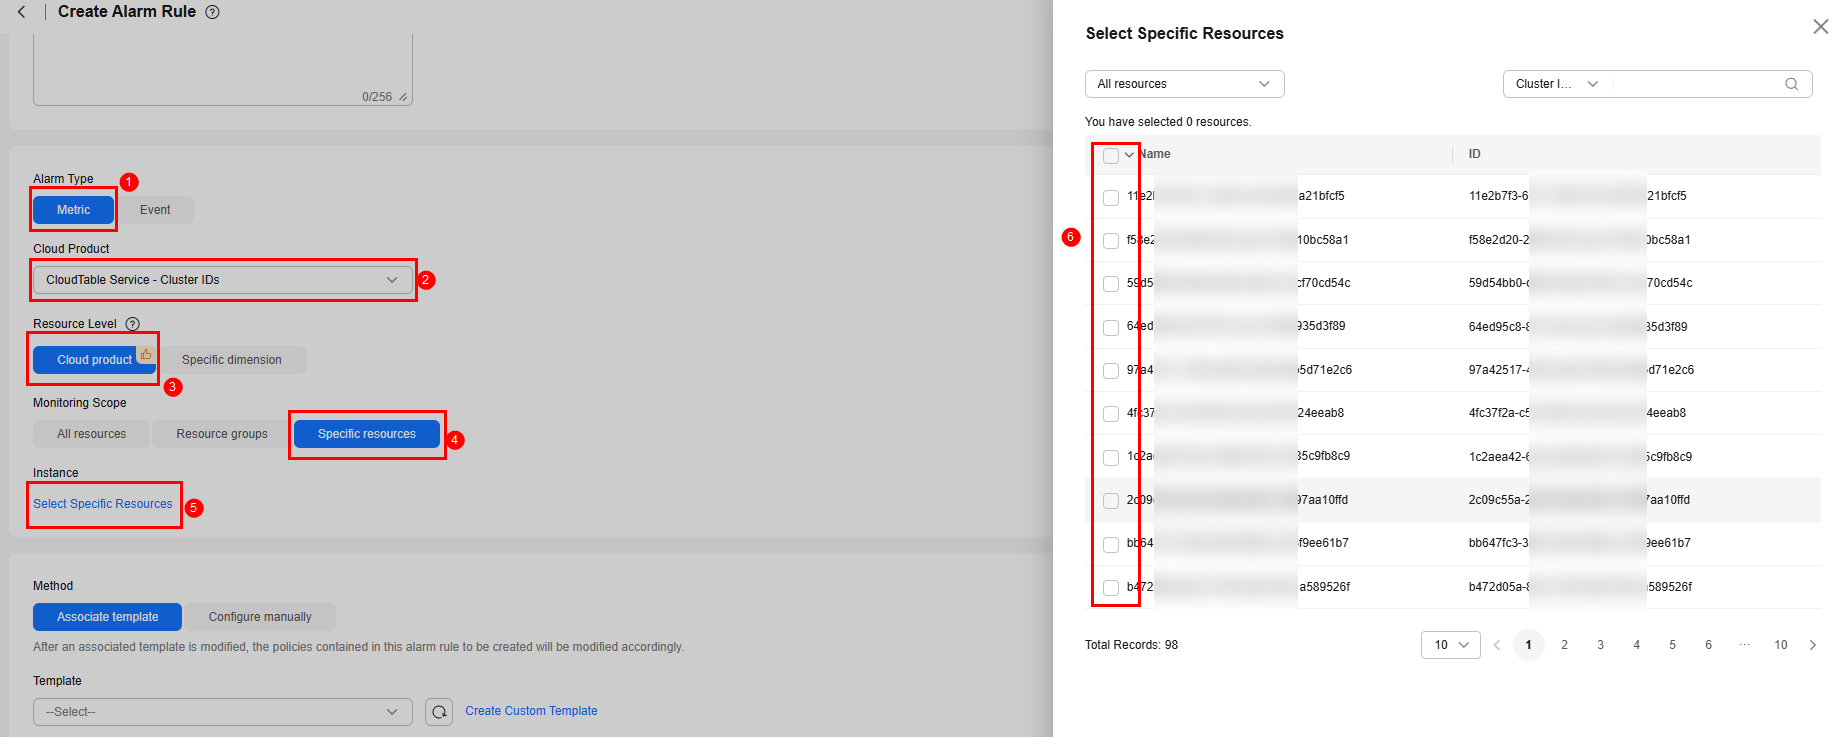
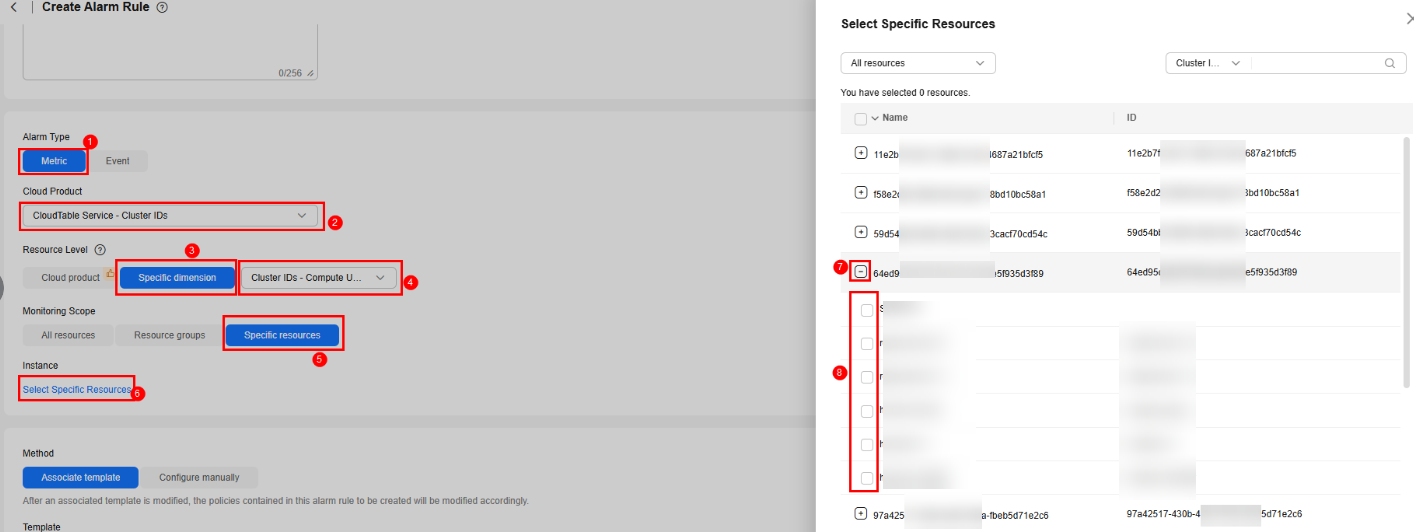
If there are no alarm rules that meet your requirements, create a CloudTable alarm rule by referring to Creating an Alarm Rule and Notifications. You need to set the following parameters and retain the default values of other parameters.
Table 1 Alarm rule configuration parameters Parameter
Description
Alarm Type
Select Metric.
Cloud Product
Select CloudTable Service.
Resource Level
Select a level as required.
- Cloud product: Alarm rules are specified by product. Metrics across dimensions can be configured in the same alarm rule.
- Specific dimension > Cluster IDs - Compute Units: Alarm rules are specified by cluster node.
Figure 1 Configuring cluster alarm rules Figure 2 Configuring alarm rules for cluster nodes
- After the configuration is complete, click Next.
After the alarm rule is created, if the metric data reaches the specified threshold, Cloud Eye will immediately inform you that an exception has occurred.
Viewing an Alarm Rule
- Log in to the CloudTable console.
- On the Cluster Management page, locate the target cluster and click View Metric in the Operation column to go to the Details page.
- Viewing alarm rules for clusters or cluster nodes.
- View cluster alarm rules. Click View Alarm Rule in the Operation of the target cluster. In the displayed dialog box, you can view all alarm rules of the cluster. Figure 3 Viewing cluster alarm rules

- View alarm rules for cluster nodes. Click
 to expand cluster nodes. Click View Alarm Rule in the Operation of the target node. In the displayed dialog box, you can view all alarm rules of the cluster node. Figure 4 Viewing alarm rules for cluster nodes
- View cluster alarm rules. Click View Alarm Rule in the Operation of the target cluster. In the displayed dialog box, you can view all alarm rules of the cluster.
Setting an Alarm Rule with Custom Monitoring Metrics for a Doris Cluster
- Log in to the CloudTable console.
- Choose Service List > Cloud Eye > Custom Monitoring > Service.CloudTable.
- Query the cluster based on the cluster ID, instance name, or tenant name.
- Click Create Alarm Rule in the Operation column. On the displayed page, set parameters and click Create Now. Figure 5 Custom monitoring

Feedback
Was this page helpful?
Provide feedbackThank you very much for your feedback. We will continue working to improve the documentation.See the reply and handling status in My Cloud VOC.
For any further questions, feel free to contact us through the chatbot.
Chatbot


