
Installing Direct Connect Metric Collection Plug-ins
Scenarios
Direct Connect metric collection plug-ins are used to monitor the end-to-end network quality of Direct Connect connections. They must be deployed on an ECS in the VPC that connects to a Direct Connect connection. By default, the plug-ins send ping packets to the remote IP address of the on-premises data center every second. Based on the ping responses, the plug-ins calculate the E2E network latency and packet loss rate of the Direct Connect connection and report these metrics to Cloud Eye.
- dc-nqa-collector: It is used to monitor automated connections and detect the latency and packet loss rate of remote subnets.
If Direct Connect resources include a physical connection, virtual gateway, and virtual interface, they are considered as automated connections. Route configurations can be automatically delivered. Most regions now use automated connections. For more information, see Direct Connect console.
- history-dc-nqa-collector: It is used to monitor historical Direct Connect connections and detect the latency and packet loss rate of remote subnets.
If Direct Connect resources include just a physical connection (no virtual gateway or interface included), they are considered as historical connections. You need to manually configure the routes. Only some legacy resources in certain regions use historical connections. For more information, see the Historical Connections page of the Direct Connect console.
Metrics
Direct Connect metric collection plug-ins are mainly used to monitor the Latency and Packet Loss Rate metrics.
| Metric ID | Metric Name | Definition | Value Range | Unit | Conversion Rule | Monitored Object (Dimension) | Monitoring Interval |
|---|---|---|---|---|---|---|---|
| latency | Latency | Network latency of a connection | ≥ 0 | ms | N/A | Virtual interfaces and historical connections | 1 minute |
| packet_loss_rate | Packet Loss Rate | Packet loss rate of a connection | 0–100 | % | N/A | Virtual interfaces and historical connections | 1 minute |
Constraints
Direct Connect metric collection plug-ins can only be installed on Linux x86 ECSs. It is recommended that you use CentOS and select 2 vCPUs and 4 GiB or higher specifications.
Prerequisites
- You have created an ECS for deploying the Direct Connect metric collection plug-in and have obtained the password of user root.
An ECS has been added to each VPC that connects to a Direct Connect connection for deploying the Direct Connect metric collection plug-in. Existing ECSs running other workloads cannot be used. You can view the associated VPCs that connect to automated connections on the virtual gateway list on the Direct Connect console. For associated VPCs that connect to historical connections, visit the historical connection list page of the Direct Connect console.
- You have granted required plug-in permissions to servers in the current region. For details, see Granting Agent Permissions for Servers by Clicking Configure.
- The Cloud Eye Agent has been installed on the server. For details, see Installing the Agent.
Procedure
In some regions, you can use the one-click installation script to install the Direct Connect metric collection plug-in. For details about the supported regions, see Table 4.

If one-click installation is unavailable in your region, submit a service ticket or contact your account manager to obtain the plug-in installation package and complete the installation.
- Log in to the ECS for deploying the plug-in as user root.
- Create a user.txt file in the usr/local/ directory and add user information, including the plug-in download link, monitored resource ID, and remote IP address.
cd /usr/local/
vi user.txt
The content of the user.txt file is in the following format:https://uniagent-xx-xxx-x.obs.myhuaweicloud.com/extension/dc/dc-nqa-collector //Link for downloading the plug-in 9dbe3905-935f-4c7b-bc41-d33a963d57d4,X.X.X.X //ID of a monitored resource 1, Remote IP address 1 (IP address of the remote gateway) b95b9fdc-65de-44db-99b1-ed321b6c11d0,X.X.X.X //ID of a monitored resource 2, Remote IP address 2 (IP address of the remote gateway)
Table 2 User information parameters User Info
Description
Plug-in Download Link
- To monitor automated connections, select the dc-nqa-collector plug-in.
- To monitor historical connections, select the history-dc-nqa-collector plug-in.
For details about links for downloading plug-in installation packages in each region, see Table 3.
Monitored Resource Info
Each monitored resource is represented on a separate line, containing a resource ID and remote IP address, separated by a comma (,).
CAUTION:- Make sure each monitored resource's ID aligns with its specific remote IP address. A single resource ID cannot link to multiple IP addresses or CIDR blocks.
- If multiple Direct Connect resources need to be monitored, add corresponding resource lines in the same format.
- Resource ID: The value contains 32 characters of letters and digits. The format is b95b9fdc-65de-44db-99b1-ed321b6c11d0 or b95b9fdc65de44db99b1ed321b6c11d0.
- For automated connections, the resource ID is that of the virtual interface.
You can log in to the Virtual Interfaces page on the Direct Connect console, and obtain the virtual interface ID from the Name/ID column in the virtual interface list.
- For historical connections, the resource ID is that of the historical connection.
You can access the Historical Connections page on the Direct Connect console, and obtain the historical connection ID from the Name column in the historical connection list.
- For automated connections, the resource ID is that of the virtual interface.
- Remote IP Address: The remote IP address is one that you can ping from the VPC. It usually matches the IP address of the remote gateway.
- For automated connections, the value is the remote gateway IP address.
You can access the Virtual Interfaces page of the Direct Connect console, click the name of the virtual interface to be viewed, and obtain the IP address of the remote gateway from the Remote Gateway field in the peer list.
- For historical connections, the value is the host IP address in the remote subnet.
You can access the Historical Information page on the console, and obtain the required host IP address from the Remote Subnet field in the historical information list.
- For automated connections, the value is the remote gateway IP address.
- Download the one-click installation script to the /usr/local/ directory.
wget Path for obtaining the one-click installation script
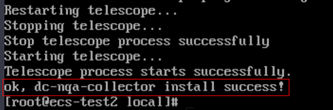
- Install the plug-in. If the information shown in Figure 1 is displayed, the installation is successful.
bash dc-installer.sh
- After the installation is successful, wait for about one hour for synchronizing Direct Connect resources.
Viewing Metrics
After Direct Connect resources are synchronized, you can view the latency and packet loss rate on the Cloud Eye console.
- Log in to the Cloud Eye console.
- In the navigation pane, choose Cloud Service Monitoring.
- In the cloud service dashboard list, click Direct Connect DCAAS.
- On the cloud service details page:
- To view the metrics of automated connections, select Virtual Interfaces from the drop-down list on the right of the Direct Connect console.
- To view the metrics of historical connections, select Historical Direct Connections from the drop-down list on the right of the Direct Connect console.
- In the instance list, locate the instance whose monitoring information you want to view and click View Metric in the Operation column.

Feedback
Was this page helpful?
Provide feedbackThank you very much for your feedback. We will continue working to improve the documentation.See the reply and handling status in My Cloud VOC.
For any further questions, feel free to contact us through the chatbot.
Chatbot


