Viewing Events
Cloud Eye monitors system events and custom events of cloud services. This helps you quickly analyze and locate faults if any. This section describes how to view event monitoring data.
Viewing Event Monitoring Data
- Log in to the Cloud Eye console.
- In the navigation pane, choose Event Monitoring.
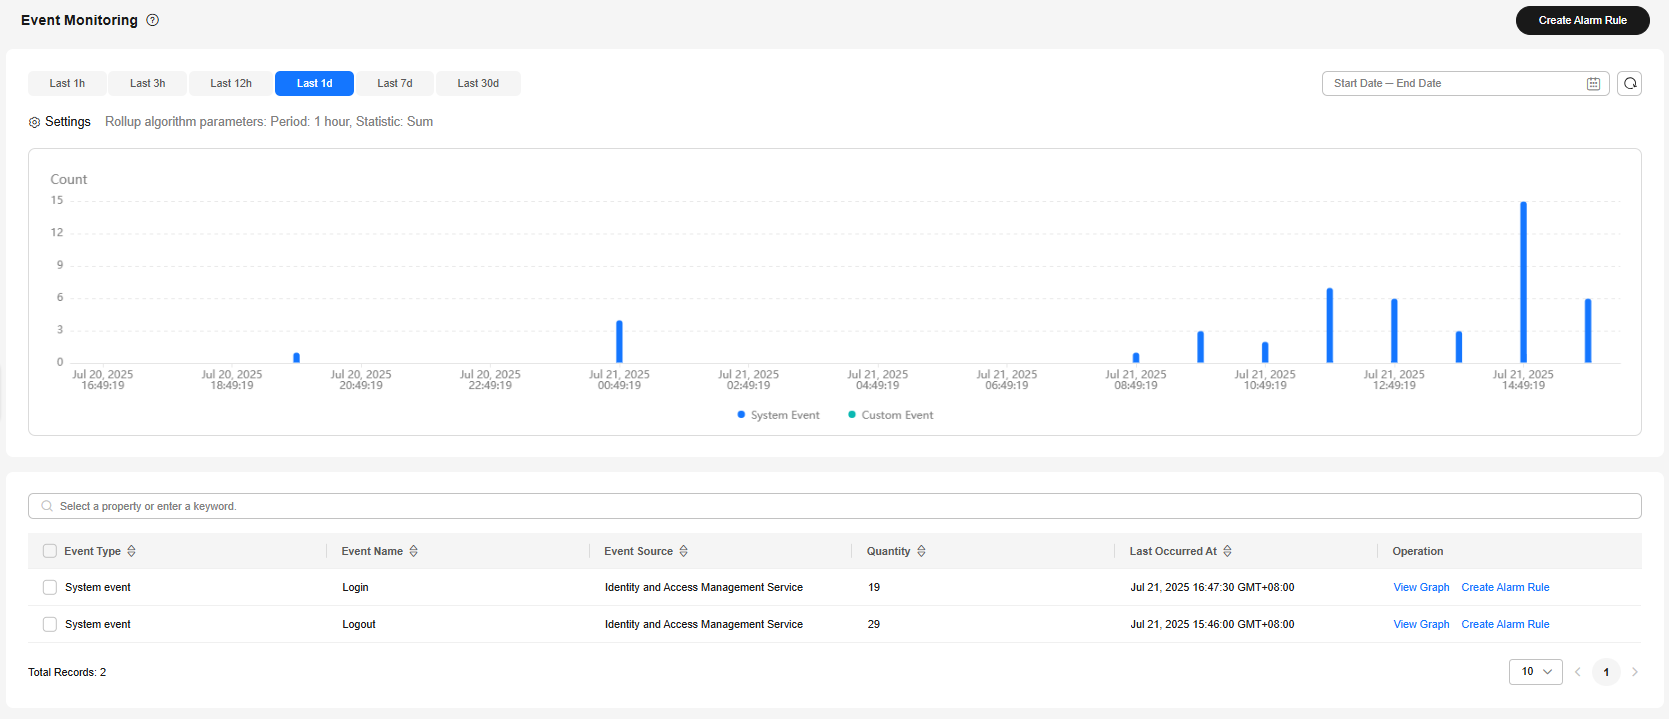
- On the displayed page, view all system events and custom events over the last 24 hours.
You can view events in the last 1 hour, last 3 hours, last 12 hours, last 1 day, last 7 days, or last 30 days. Alternatively, you can set a custom time range to view events triggered within that period.Figure 1 Event monitoring

Table 1 Event monitoring parameters Parameter
Description
Event Type
Event type, which can be either System event or Custom event. For details, see Event Monitoring Type.
Event Subcategory
NOTE:This feature is only available in certain regions. You can see these regions on the console.
Subcategory of the reported event.
- When Event Type is set to System event, the options are as follows:
- When Event Type is set to Custom event, the event subcategory is a custom event.
Event Name
Instantaneous operations users performed on resources, such as login and logout.
- For details about system events supported by each cloud service, see Events Supported by Event Monitoring.
- For a custom event, the event name is the value of event_name when the custom event is reported.
Event Source
The service the event is generated for.
For a custom event, set Event Source to the value of event_source.
Quantity
Number of times that the event is reported in the selected period.
Last Occurred At
Time when the event last occurred.
Operation
You can view the graphs or create an alarm rule.
Viewing graphs
- Log in to the Cloud Eye console.
- In the navigation pane, choose Event Monitoring.
- On the Overview tab, locate the event you want to view and click View Graph in the Operation column.
On the Details tab, filter the event by event type, event name, or event source.
The event details list displays all resources that report the event. For details, see Table 2.Table 2 Event details list Parameter
Description
Resource Name
Name of the resource from which the event is reported.
ID
ID of the resource from which the event is reported.
Event Type
Event type, which can be either System event or Custom event. For details, see Overview.
Event Subcategory
NOTE:This feature is only available in certain regions. You can see these regions on the console.
Subcategory of the reported event.
- When Event Type is set to System event, the options are as follows:
- When Event Type is set to Custom event, the event subcategory is a custom event.
Event Name
Instantaneous operations users performed on resources, such as login and logout.
For details about system events supported by each cloud service, see Events Supported by Event Monitoring.
For a custom event, the event name is the value of event_name when the custom event is reported.
Event Source
The service the event is generated for.
For a custom event, set Event Source to the value of event_source.
Event Severity
Severity of an event. The value can be Critical, Major, Minor, or Warning.
Event Status
Status of an event. The value can be normal, Warning, or Incident.
Operator
User who reports the event.
Occurred At
Time when an event occurs.
Operation
Click View Event to view the event details.
Configuring a Blacklist and Whitelist
You can set a blacklist or whitelist to display only specified events.
- Log in to the Cloud Eye console.
- In the navigation pane, choose Event Monitoring.
- Click Configure Whitelist and Blacklist in the upper right corner.
- On the displayed page, select the list type and select the events to be added to the list.
- Whitelist: Only whitelisted events will be displayed on the Event Monitoring page.
- Blacklist: Blacklisted events will not be displayed on the Event Monitoring page.
- Click OK.
Events in the whitelist will be displayed in the event monitoring list.
- (Optional) Clear the blacklist or whitelist.
- Click Configure Whitelist and Blacklist in the upper right corner.
- Deselect all events in the blacklist or whitelist.
- In the Delete Whitelist or Blacklist dialog box, click OK.
All events reported in the selected period are displayed in the event monitoring list.
Helpful Links
If you do not create an alarm notification for event monitoring, you will not receive any alarm notifications by default. To get real-time notifications, create an alarm notification. For details, see Creating an Alarm Rule and Notification for Event Monitoring.
Feedback
Was this page helpful?
Provide feedbackThank you very much for your feedback. We will continue working to improve the documentation.See the reply and handling status in My Cloud VOC.
For any further questions, feel free to contact us through the chatbot.
Chatbot


