

Configuring Monitoring and Alarm Rules Using PrometheusRule
Prometheus provides PrometheusRule for defining monitoring and alarm rules. This allows you to use Prometheus to query metrics based on monitoring rules and configure PromQL-based alarm rules.

PrometheusRule is available only when Cloud Native Cluster Monitoring is enabled with local data storage.
How Do I Configure Recording Rules Using PrometheusRule?
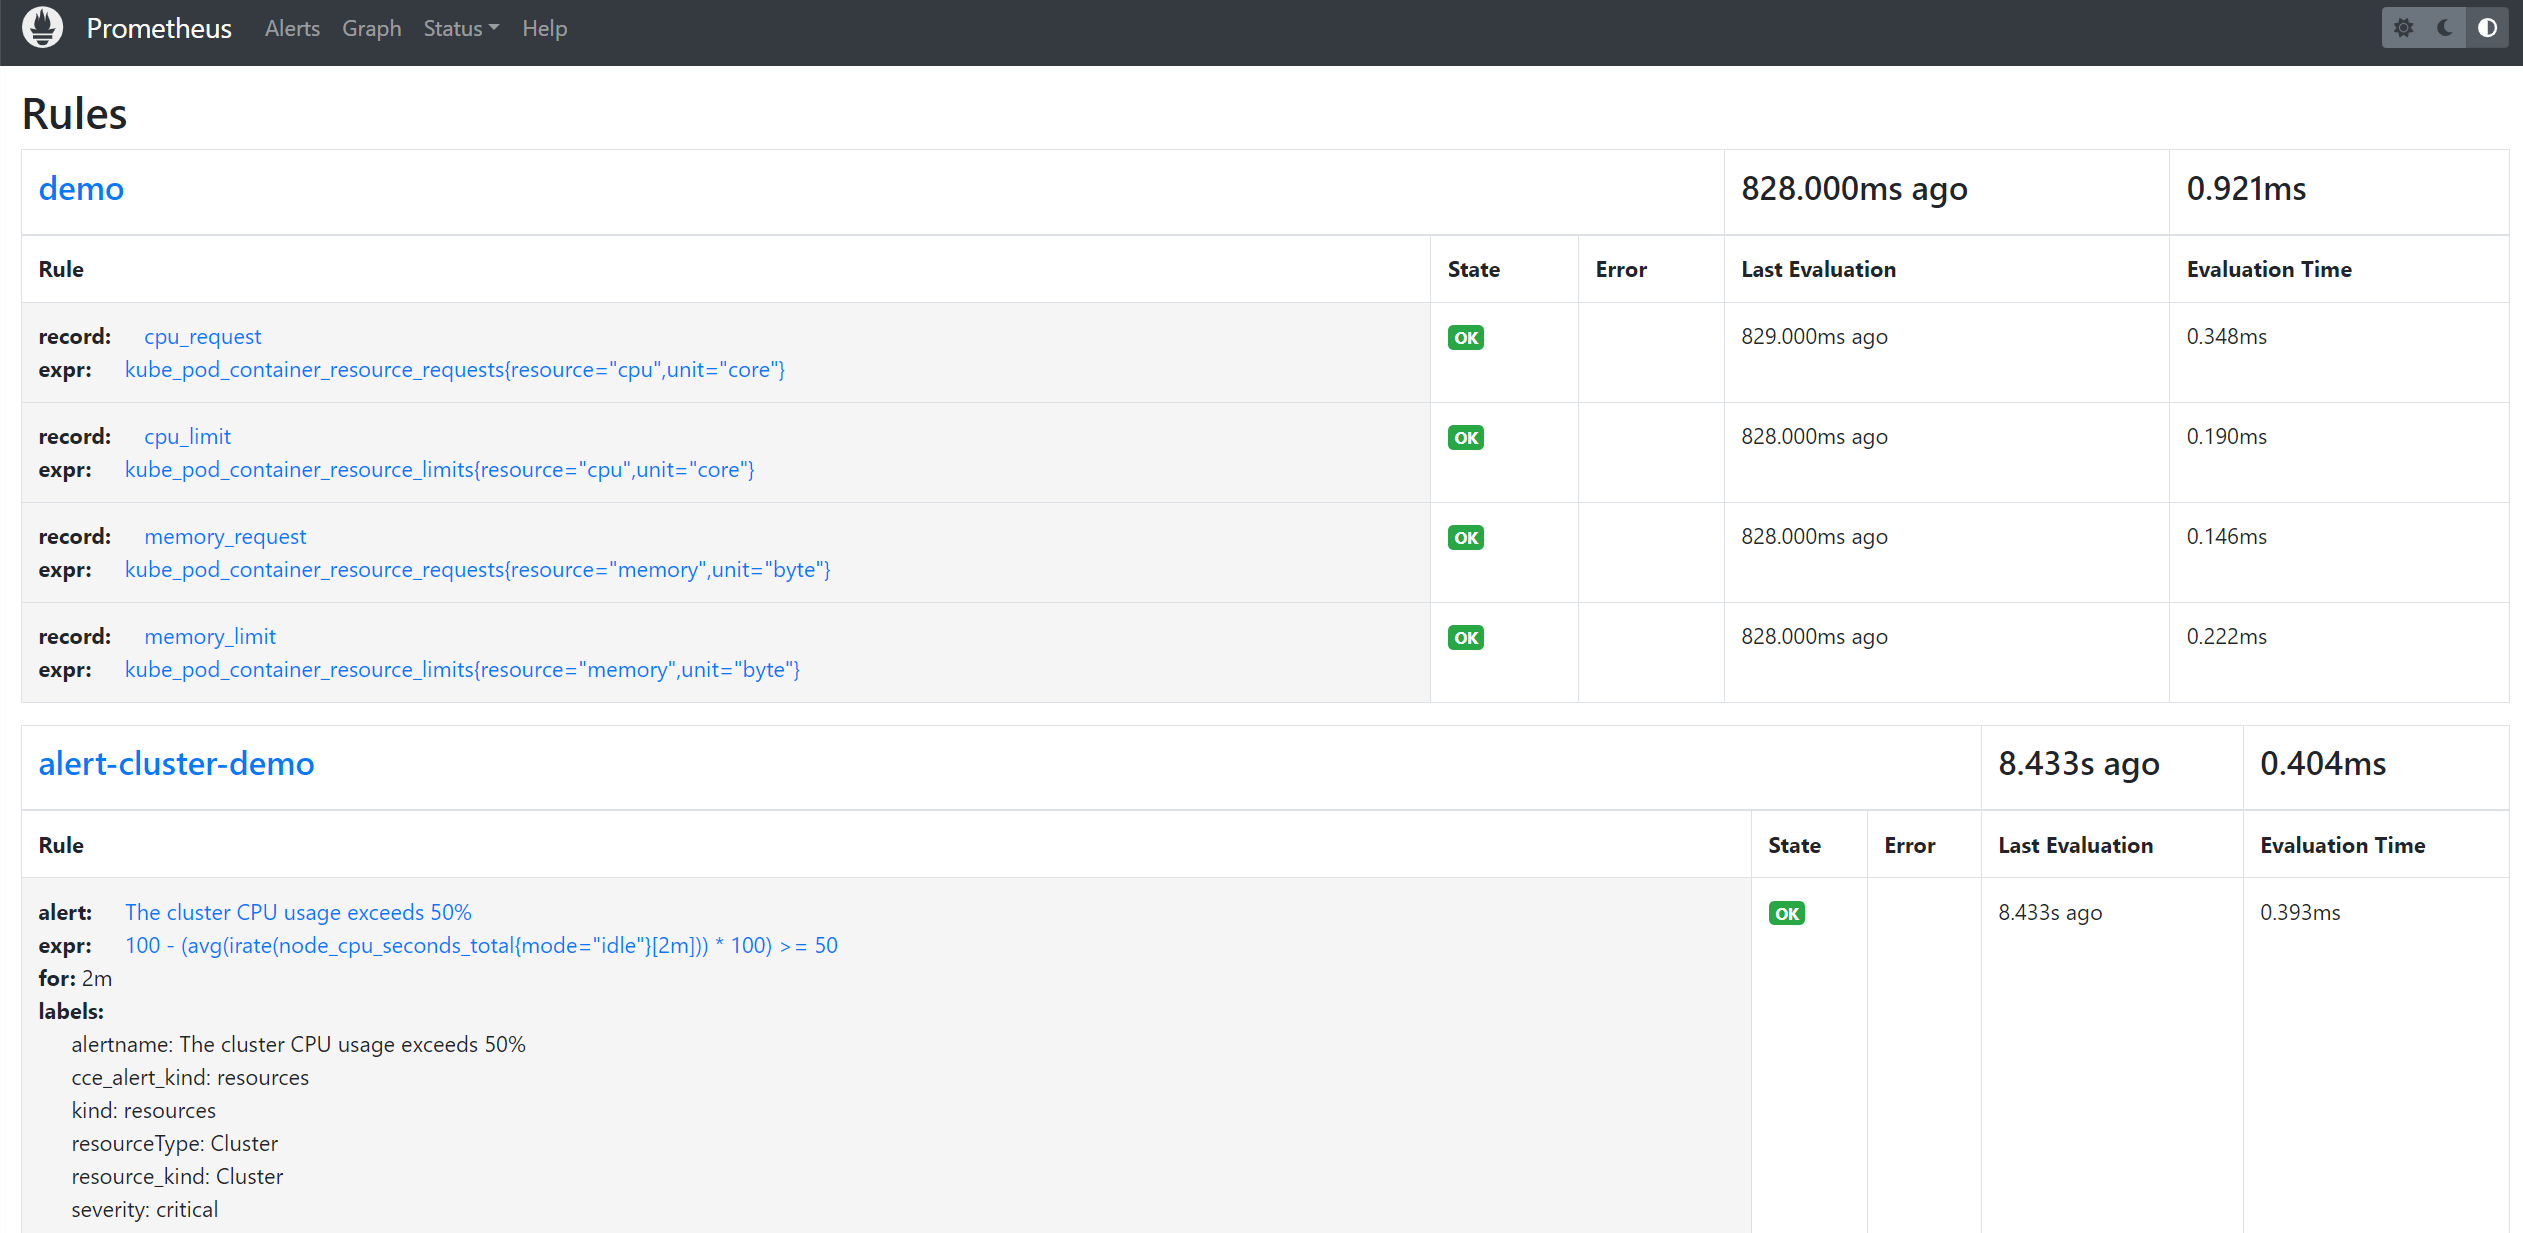
- Create custom recording rules for querying metrics using PrometheusRule.
apiVersion: monitoring.coreos.com/v1 kind: PrometheusRule metadata: name: recording-rules-demo namespace: monitoring labels: role: operator-prometheus # (Mandatory) The value must be the same as that of the ruleSelector field configured in the Prometheus CR. spec: groups: - name: demo interval: 15s rules: - record: cpu_request expr: kube_pod_container_resource_requests{resource="cpu",unit="core"} - record: cpu_limit expr: kube_pod_container_resource_limits{resource="cpu",unit="core"} - record: memory_request expr: kube_pod_container_resource_requests{resource="memory",unit="byte"} - record: memory_limit expr: kube_pod_container_resource_limits{resource="memory",unit="byte"} - Access the Prometheus web page and choose Status > Rules to view the configured PrometheusRule.
How Do I Configure Alarm Rules Using PrometheusRule?
You can create Prometheus alarm rules by configuring the PrometheusRule custom resource. This section uses the cluster CPU usage alarm as an example to describe how to create an alarm configuration template.
- Create an alarm rule template.
kubectl apply -f PrometheusRule.yaml
Example configuration of PrometheusRule.yaml:
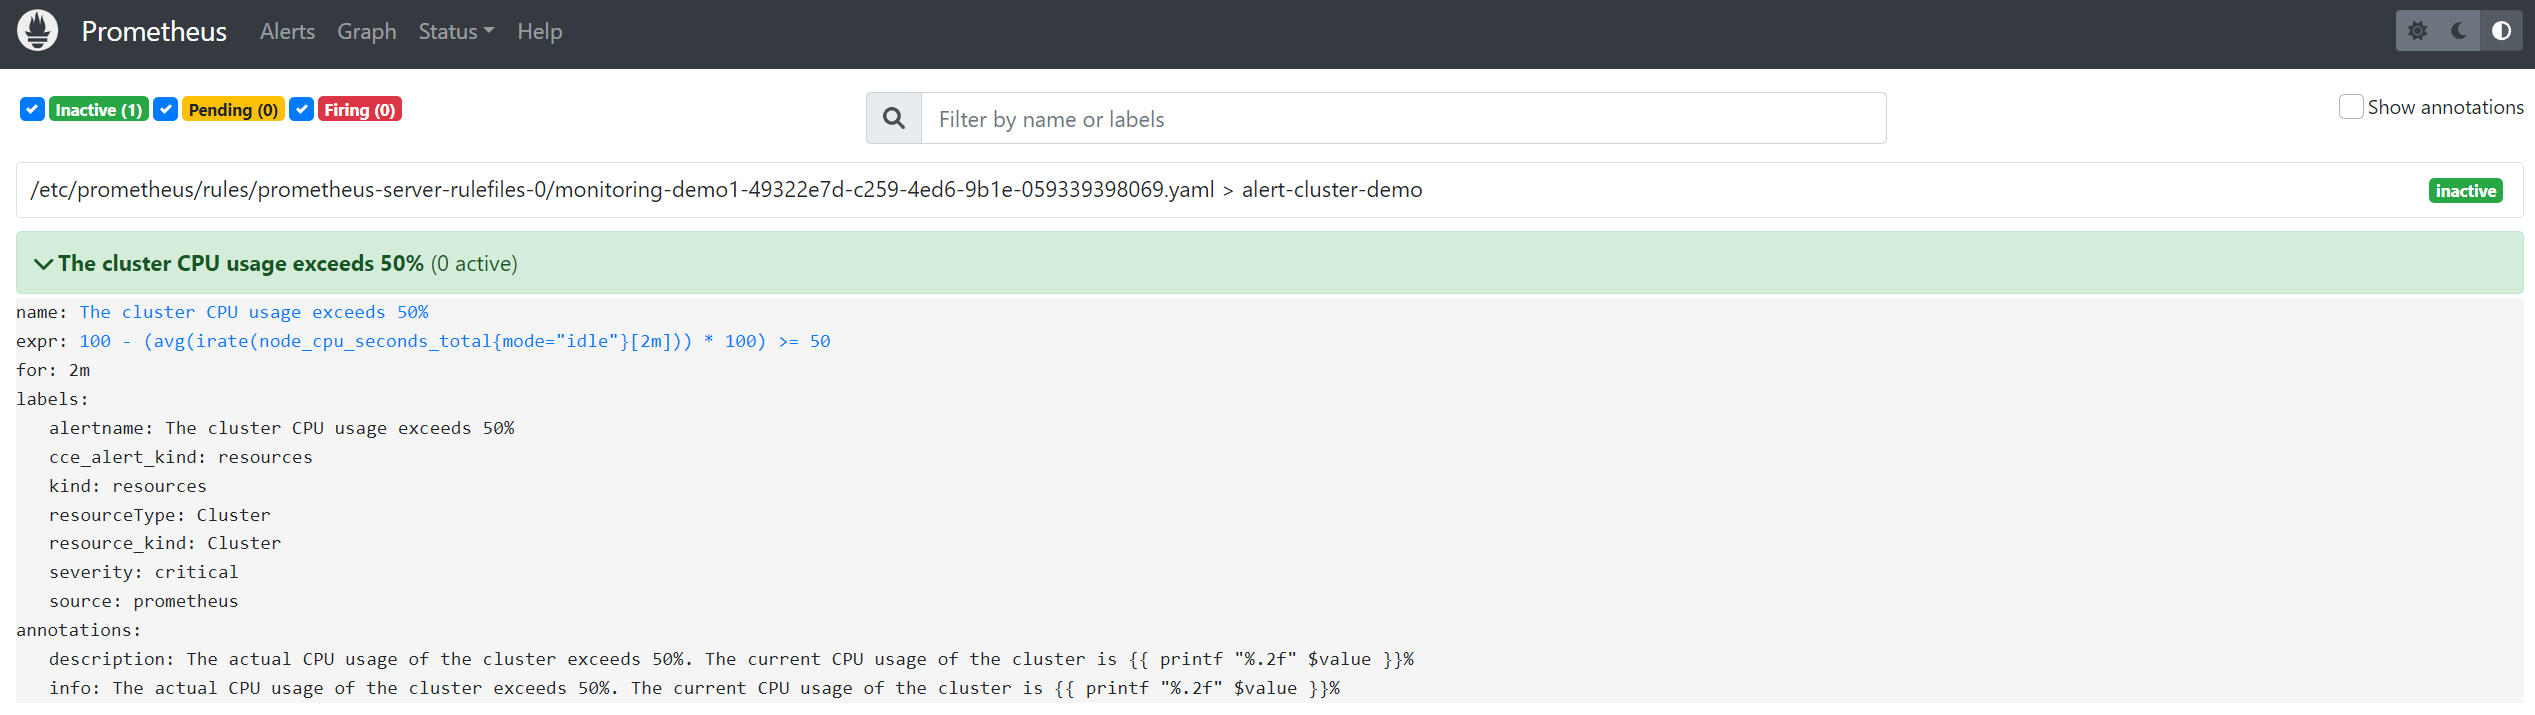
apiVersion: monitoring.coreos.com/v1 kind: PrometheusRule metadata: labels: role: operator-prometheus # (Mandatory) The value must be the same as that of the ruleSelector field configured in the Prometheus CR. name: alert-rules-demo namespace: monitoring spec: groups: - name: alert-cluster-demo rules: - alert: The cluster CPU usage exceeds 50%. expr: 100 - (avg (irate(node_cpu_seconds_total{mode="idle"}[2m])) * 100) >=50 for: 2m labels: severity: critical cce_alert_kind: resources alertname: Cluster CPU usage exceeds 50% kind: resources resource_kind: Cluster resourceType: Cluster source: prometheus annotations: info: "The actual CPU usage of the cluster exceeds 50%. The current CPU usage of the cluster is {{ printf \"%.2f\" $value }}%". description: "The actual CPU usage of the cluster exceeds 50%. The current CPU usage of the cluster is {{ printf \"%.2f\" $value }}%". - Access the Prometheus web page and choose Alerts. On the displayed page, check whether the alarm rules are triggered or take effect.
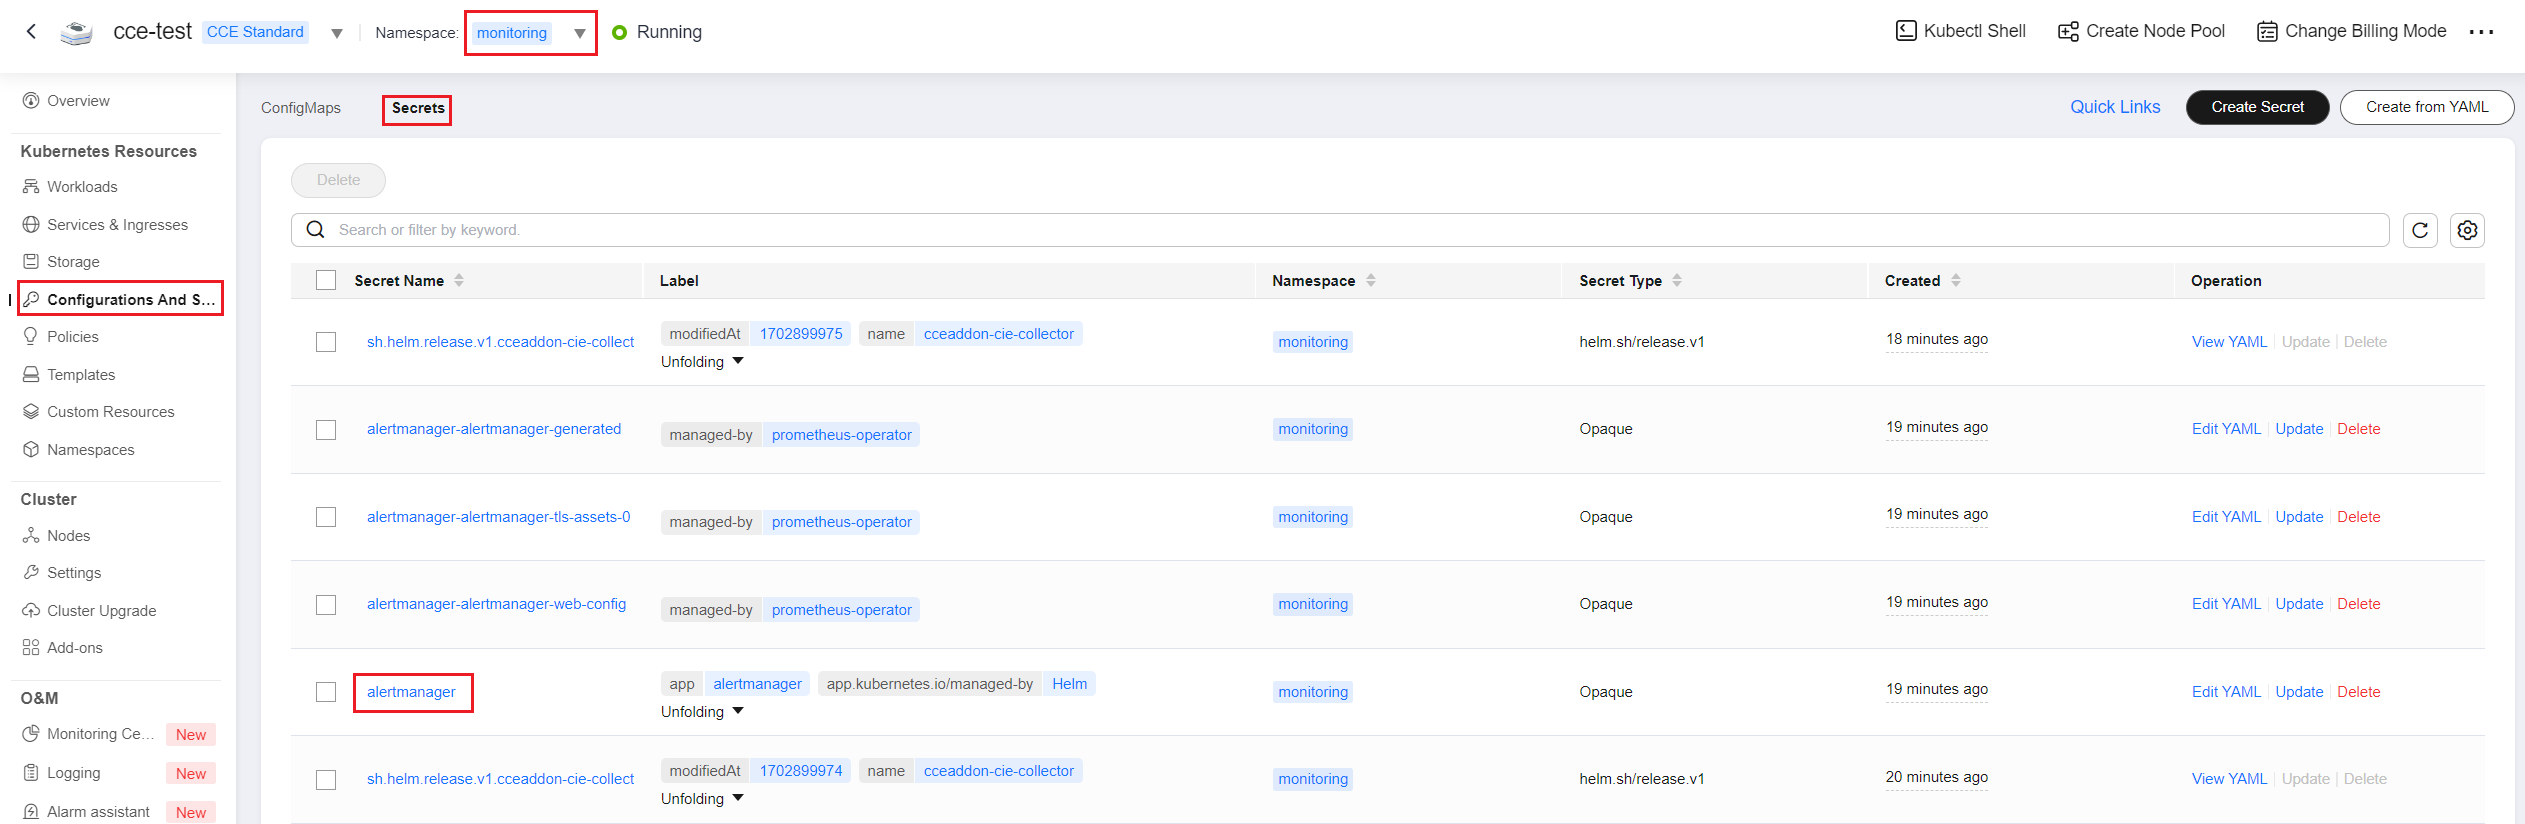
- The Prometheus add-on automatically pushes alarms to Alertmanager. To configure an alarm recipient, configure the secret named alertmanager in the monitoring namespace.

According to the alertmanager-alertmanager StatefulSet YAML file, alarm data is stored in the pod disk. However, if the pod is restarted, the alarm data will be lost. To persistently store the data, create a PVC, modify the Alertmanager custom resource to reference the PVC, and associate the PVC with the pod.
What is your overall rating for this page?
Thank you very much for your feedback. We will continue working to improve the documentation.See the reply and handling status in My Cloud VOC.
For any further questions, feel free to contact us through the chatbot.
Chatbot


