Configuring a Metric AS Policy
This section describes how to configure a metric AS policy. Currently, instances can be automatically added or deleted based on CPU, memory thresholds, and custom metrics. This frees you from repeatedly adjusting resources to keep up with service changes and peak pressures, helping you reduce resources and labor costs.

CAE instance scaling is calculated by current and expected metrics.
Expected instances = ceil [Current instances * (Current metrics/Expected metrics)] (ceil is rounded up.)
There is an error tolerance of 10% to prevent frequent fluctuation of instance quantity, so there is no scaling when Current metrics/Expected metric ranges from 0.9 to 1.1.
Application Scenario
This policy is useful for burst traffic and typical periodic traffic, mainly in industries such as the Internet, games, and social platforms.
Configuring a Metric AS Policy
- Log in to CAE.
- Choose Component Configurations.
- Select the target component from the component drop-down list in the upper part of the page.
- Click Edit in the AS Policies module.
- Click
 to enable the auto scaling policy, select Metric, and configure the policy by referring to Table 1.
Table 1 Configuring a metric policy Parameter
Description
Max. Instances
Max. number of instances that can be reached during scale-out.
Value range: 1 to 99.
NOTE:Max. Instances cannot be less than Min Instances.
Min Instances
Min number of instances that can be reached during scale-in.
Value range: 1 to 99.
Metric
- CPU usage, a preset metric in the system
- Memory usage, a preset metric in the system
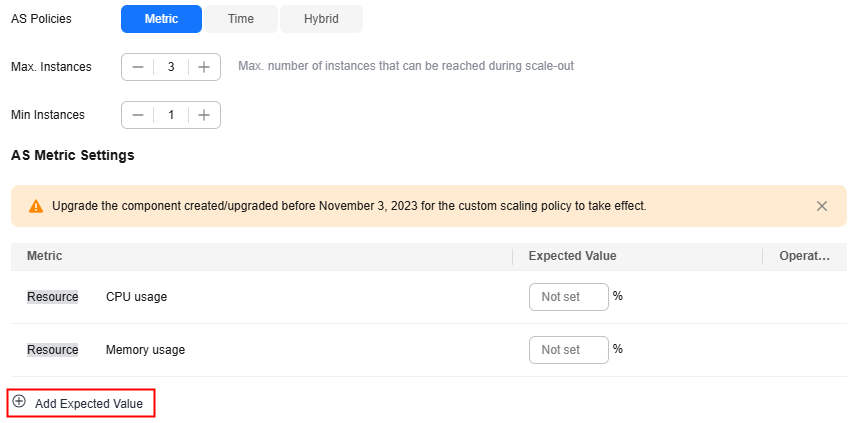
- Custom metrics. Click Add Expected Value and select a custom metric from the drop-down list to add a custom metric. For details about how to create a custom metric, see Configuring Custom Metrics.
You can add multiple custom metrics.NOTE:
- You must enter a PromQL statement. PromQL is a built-in data query language from Prometheus, and is used to select, aggregate, and perform logical calculation on time series data. For details, see Prometheus.
- The query result of the PromQL statement must be a single value of the vector or scalar type.
- Upgrade the component created/upgraded before November 3, 2023 for the custom scaling policy to take effect.
You can scale instances based on the CPU and memory thresholds.
For example, set the maximum expected CPU usage to 80 and memory usage to 70. When the CPU usage of a component is greater than 80% or the memory usage is greater than 70%, the system automatically increases the number of component instances. When the CPU usage of a component is less than 80% and the memory usage is less than 70%, the system automatically reduces the number of component instances.
Figure 1 Configuring a metric policy
- (Optional) Expand Advanced Settings and configure advanced settings by referring to Table 2.
Table 2 Configuring advanced settings Parameter
Description
Scale-out Step
Number of pods to be added per minute.
Value range: 1 to 99. Default value: 4.
Stable Scale-out Window (s)
Value range: 1 to 3600, in seconds. Default value: 0.
Scale-in Step
Number of pods to be reduced per minute.
Value range: 1 to 99. Default value: 99.
Stable Scale-in Window (s)
Value range: 1 to 3600, in seconds. Default value: 300.
Disable Scale-in
Click
 to disable scale-in.Figure 2 Advanced settings
- Click OK.
- Click Activate Settings in the upper part of the page. In the dialog box displayed on the right, confirm the configurations and click OK for the configurations to take effect.
Configuring a Custom QPS Metric AS Policy
- Create a custom monitoring metric named qps_metric by referring to Configuring Custom Metrics.
- On the metric scaling page, click Add Expected Value.
Figure 3 Adding a scaling metric

- Select the configured metric from the drop-down list. Set the PromQL statement as follows and set the expected value to 100.
sum(rate(envoy_cluster_upstream_rq_total{cluster_name=~".*{Component name}.*{Environment name}.svc.cluster.local"}[30s]))Replace {Component name} and {Environment name} with the actual names.
Example: sum(rate(envoy_cluster_upstream_rq_total{cluster_name=~".*componentA.*environmentA.svc.cluster.local"}[30s]))

The PromQL statement indicates the average QPS of all requests forwarded to a specified component and environment in the last 30 seconds.
If the value is greater than the expected value, the system automatically increases the number of component instances.
If the value is less than the expected value, the system automatically reduces the number of component instances.
- Click OK.
- Click Activate Settings in the upper part of the page. In the dialog box displayed on the right, confirm the configurations and click OK for the configurations to take effect.
Configuring the Custom click_operated_total Metrics
- Create a custom monitoring metric named click_operated_total by referring to Configuring Custom Metrics.
- On the metric scaling page, click Add Expected Value.
Figure 4 Adding a scaling metric

- Select the configured click_operated_total from the drop-down list. Set the PromQL statement as follows and set the expected value to 10.
max(avg_over_time(click_operated_total{environment_name="{Environment name}",application_name="{Application name}",component_name="{Component name}"}[1m]))Replace {Environment name}, {Application name}, and {Component name} with the actual names.
Example: max(avg_over_time(click_operated_total{environment_name="environmentA",application_name="applicationA",component_name="componentA"}[1m]))

The PromQL statement indicates the maximum average value of click_ operated_total per minute of all instances in a specified component.
If the value is greater than the expected value, the system automatically increases the number of component instances.
If the value is less than the expected value, the system automatically reduces the number of component instances.
- Click OK.
- Click Activate Settings in the upper part of the page. In the dialog box displayed on the right, confirm the configurations and click OK for the configurations to take effect.
Feedback
Was this page helpful?
Provide feedbackThank you very much for your feedback. We will continue working to improve the documentation.See the reply and handling status in My Cloud VOC.
For any further questions, feel free to contact us through the chatbot.
Chatbot


