Configuring Custom Metrics
The Prometheus component is deployed on CAE internal nodes. Data is collected every 15 seconds. You can use this method to report custom component monitoring metrics.
Precautions
- Currently, only the four types supported by Prometheus can be obtained.
- Before configuring custom monitoring for application components, you need to understand Prometheus and provide the GET API for obtaining custom metric data in your application components so that CAE can obtain the data through this API. Prometheus provides clients in various languages, including Go, Java, Python, Ruby, and Net. For details about the clients, see Client Libraries. For details about how to develop exporter, see Writing Exporters. The Prometheus community provides various third-party exporters that can be directly used. For details, see Exporters and Integrations.
Configuring Custom Metrics
- Log in to CAE.
- Choose Component Configurations.
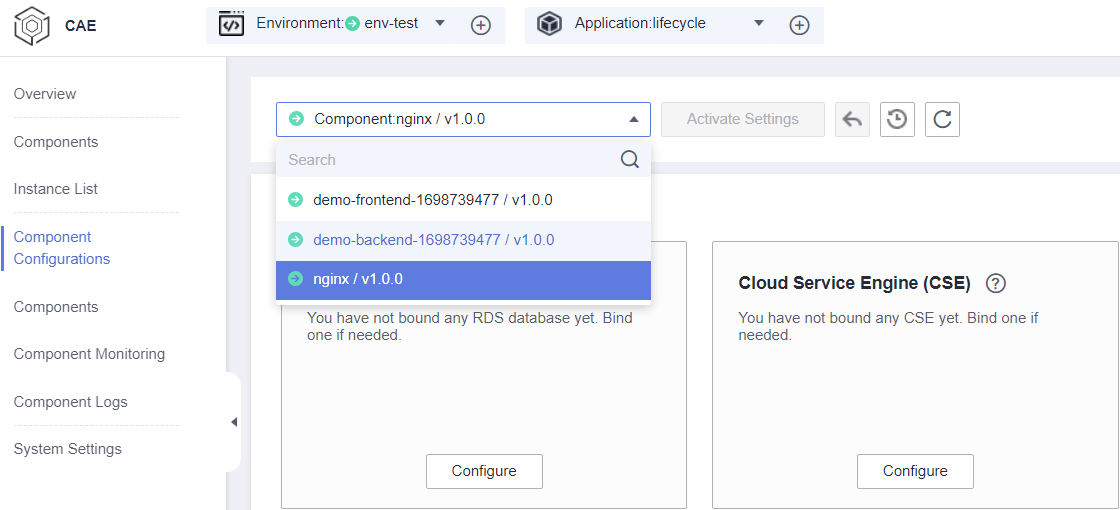
- Select the target component from the drop-down list in the upper part of the page.
Figure 1 Selecting a component

- Click Edit in the Custom Metric module.
- Click
 to enable custom metrics. Configure the custom metric by referring to Table 1.
Table 1 Custom metric parameters Parameter
Description
Collection Path
Path exposed by the component using the GET method for CAE to obtain custom metric data.
For example, /actuator/prometheus.
Collection Port
Port exposed by the component using the GET method for CAE to obtain custom metric data.
Value range: 1 to 65535.
For example: 9090.
Metric
Name of the custom metric exposed by the component using the GET method. For easy understanding, ensure that the name can reflect the actual meaning. For details, see Metric and Label Naming.
For example, to define the number of clicks of a button, name it click_ operated_total.
If the metric exposed by the component is inconsistent with the entered metric name, the metric does not take effect.
The metric name contains 5 to 100 characters, including only letters, digits, and underscores (_).
- (Optional) Click Add Monitoring Metric to add more custom metrics.
- Click OK.
- Make the configurations take effect.
- If the component has been deployed, click Activate Settings in the upper part of the page. In the dialog box displayed on the right, confirm the configurations and click OK for the configurations to take effect.
- If the component has not been deployed, click Set and Deploy Component in the upper part of the page. In the dialog box displayed on the right, click OK. After the deployment is complete, the configurations take effect.
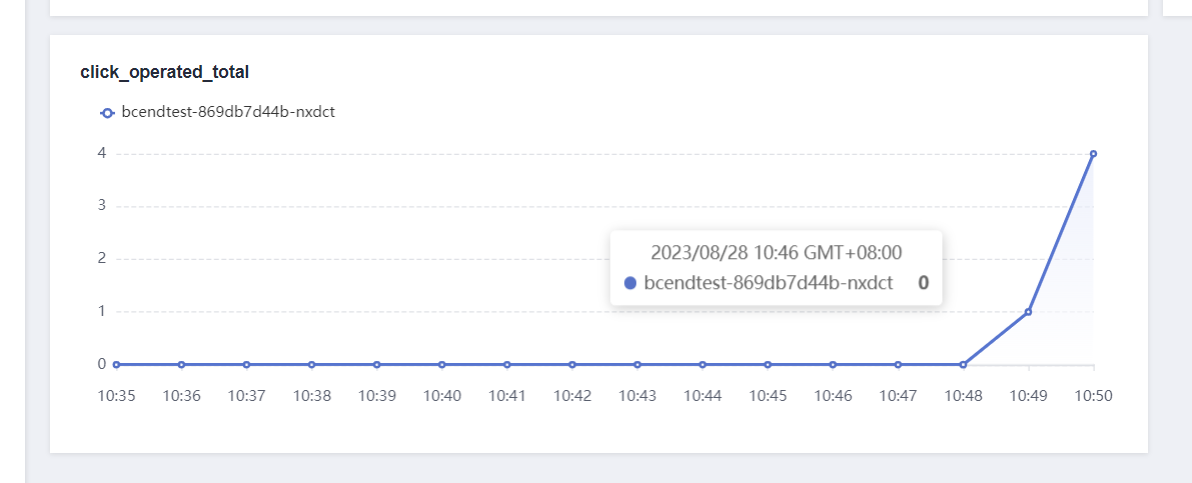
- After the configuration and deployment are complete, you can view monitoring metrics on the Component Monitoring page.
Figure 2 Viewing custom metrics

Editing Custom Metrics
- Log in to CAE.
- Choose Component Configurations.
- Select the target component from the drop-down list in the upper part of the page.
- Click Edit in the Custom Metric module.
- Edit or delete a monitoring metric.
- Reconfigure the parameters by referring to Table 1.
- Click
 next to a metric to delete it.
- Click OK.
- Click Activate Settings in the upper part of the page. In the dialog box displayed on the right, confirm the configurations and click OK for the configurations to take effect.
Disabling Custom Metrics
- Log in to CAE.
- Choose Component Configurations.
- Select the target component from the drop-down list in the upper part of the page.
- Click Edit in the Custom Metric module.
- Click
 to disable custom metrics. Click OK.
 - In the displayed dialog box, enter SWITCHOFF and click OK.
- Click Activate Settings in the upper part of the page. In the dialog box displayed on the right, confirm the configurations and click OK for the configurations to take effect.
- After the configurations take effect, the custom metric data of the corresponding instance is not displayed on the Component Monitoring page.
Feedback
Was this page helpful?
Provide feedbackThank you very much for your feedback. We will continue working to improve the documentation.See the reply and handling status in My Cloud VOC.
For any further questions, feel free to contact us through the chatbot.
Chatbot


