Component Settings
Component settings include log association setting, Profiler setting, and database monitoring setting.
Procedure
- Log in to the APM console.
- Click
 on the left and choose Application > Application Performance Management.
 - In the navigation pane, choose Application Monitoring > Metrics.
- In the tree on the left, click
 next to the target environment. The instance monitoring page is displayed.
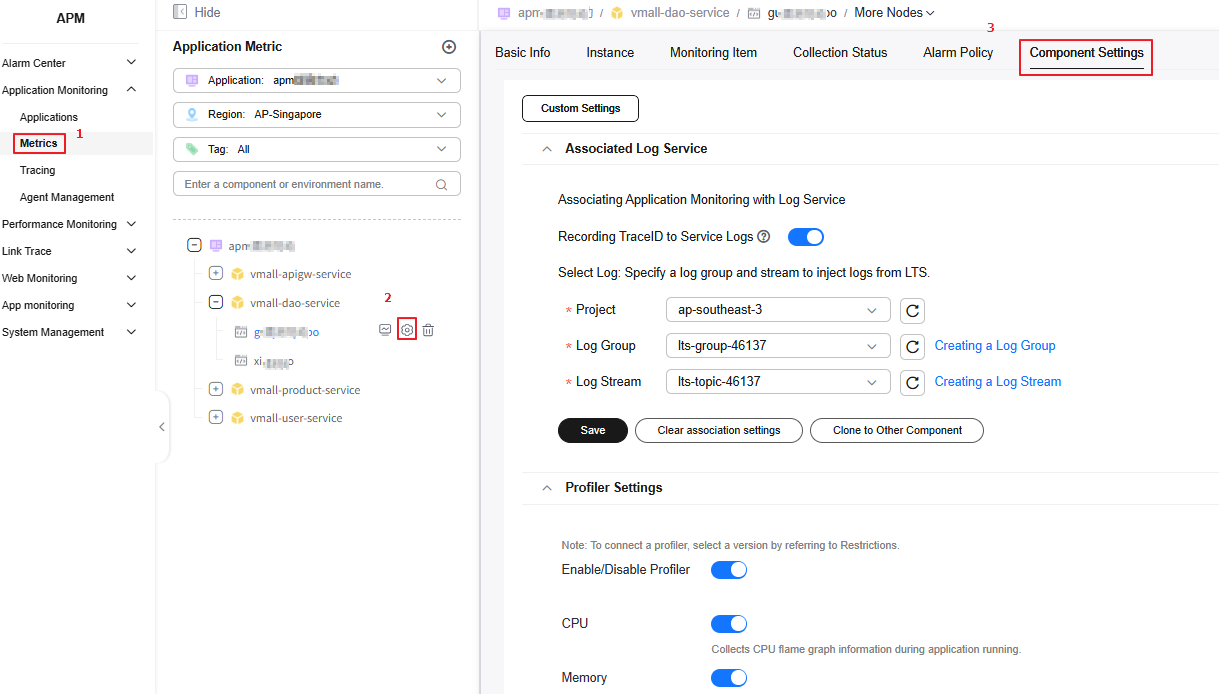
 - Click the Component Settings tab.
Figure 1 Component settings
- Click Multiplexing to Other Component.
- On the displayed page, select one or more components and click Clone to Other Component. The log association setting, Profiler setting, and database monitoring setting will then be copied to the selected components.
Before you click Clone to Other Component and Multiplexing to Other Component, ensure that the components you selected contain environments. Otherwise, these buttons will be grayed and your settings cannot be cloned.
Figure 2 Settings cannot be cloned to other components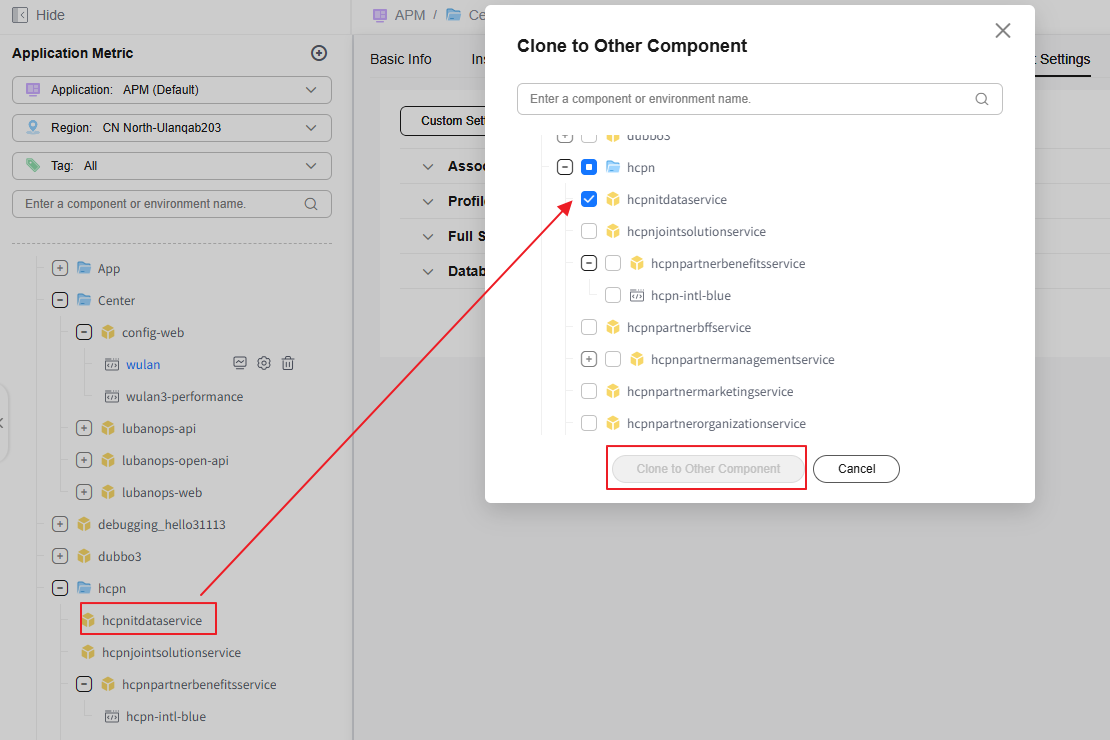
Associating Traces with Logs
Trace IDs can be associated with logs in Log Tank Service (LTS). Then you can find out the logs based on the associated trace IDs for fast troubleshooting.
- Printing trace IDs to service logs
- If you need to print trace IDs to service logs, thread names must be printed to logs first. The following figure shows how to print thread names to logs. That is, add the %thread field to the logback.xml file.

- If this function is enabled, trace IDs are automatically generated in service logs.
- If this function is disabled, the log association setting becomes ineffective.
- If you need to print trace IDs to service logs, thread names must be printed to logs first. The following figure shows how to print thread names to logs. That is, add the %thread field to the logback.xml file.
- The Log4j, Log4j2, and Logback log components are supported for associating service logs.
- Only the Java type is supported.
- Under log association settings, enter related information.
Table 1 Parameters for log association settings Parameter
Description
Project
Select a project from the drop-down list.
Log Group
A log group is a group of log streams which share the same log retention settings. Up to 100 log groups can be created for a single account. For how to create a log group, see Creating a Log Group.
Log Stream
A log stream is the basic unit for reading and writing logs. You can put different types of logs into different streams to ease management. For how to create a log stream, see Creating a Log Stream.
- Click Save.
Figure 3 Saving the log association setting

- In the displayed dialog box, click Confirm.
- Perform other operations if needed.
- Cloning the setting to other components
- Click Clone to Other Component.
- On the displayed page, select one or more components and click Clone to Other Component. The current log association setting will then be copied to the components you have selected.
- Clearing the association setting
- Click Clear Association Settings. The Clear Association Settings dialog box is displayed.
- On the displayed page, select one or more components and click Clone to Other Component. The current log association setting will then be cleared for the components you have selected.
- Before you click Clone to Other Component or Clear Association Settings, ensure that the components you selected contain environments. Otherwise, the button will be grayed and your settings cannot be cloned.
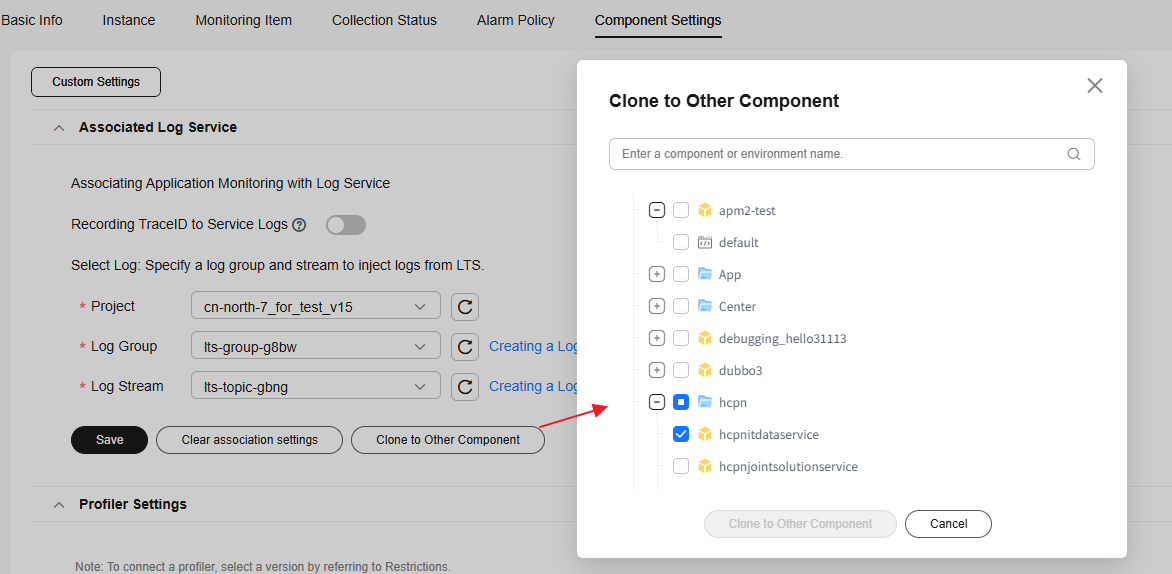
- Cloning the setting to other components
Profiler Setting
- Under Profiler Settings, enter related information.
Figure 4 Profiler setting
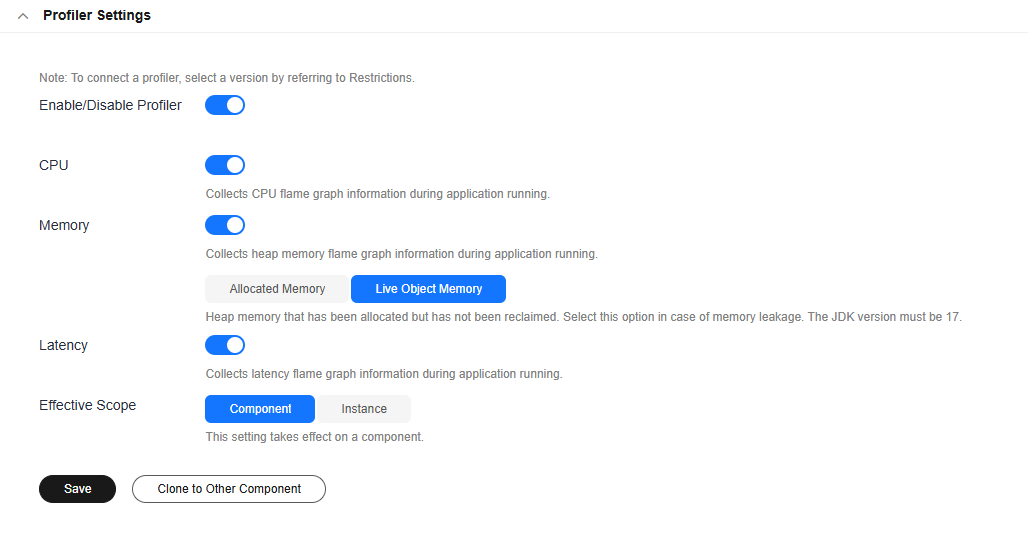
Table 2 Profiler setting Parameter
Description
Enable/Disable Profiler
If this option is enabled, APM will diagnose applications to solve performance bottlenecks caused by high CPU/memory usage or latency.
This option is disabled (
 ) by default. If this option is disabled, other options will also be disabled.
CPU
Collects CPU flame graph information during application running.
This option is disabled (
 ) by default.
Memory
Collects heap memory flame graph information during application running.
This option is disabled (
 ) by default.
Latency
Collects latency flame graph information during application running.
This option is disabled (
 ) by default.
Effective Scope
- This setting takes effect in a component. Profiler data is generated for all instances associated with the component. This option is enabled (blue toggle) by default.
- Instance: This setting takes effect in instances. Profiler data is generated only for the selected instance. By default, this option is disabled (
 ).
).
- Click Instance. The instance button is in blue.
- Click Select Instance to select required instances.
Figure 5 Selecting instances

- Select one or more instances and click Confirm. If Effective Scope is set to Instance, the settings cannot be cloned to other components or environments.
Figure 6 Selecting required instances

- Component and Instance cannot be selected at the same time.
- Click Save.
- In the displayed dialog box, click Confirm.
- Click Clone to Other Component.
Figure 7 Cloning the setting to other components
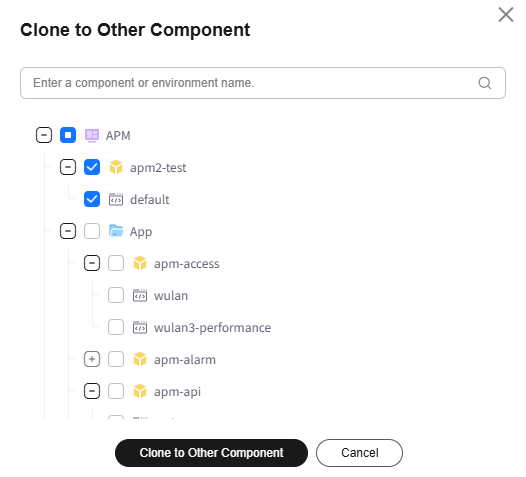
- On the displayed page, select one or more components and click Clone to Other Component. The current Profiler setting will then be copied to the components you have selected.
Database Monitoring Setting
You can define a slow SQL threshold. Requests that exceed this threshold are regarded as slow and will be displayed on the URL page and in monitoring reports.
- On the Component Settings page, set Slow SQL Threshold under Database Monitoring Setting.
- Value range: [100, 20000]. The default value is the same as the SQL threshold configured in the system.
Figure 8 Database monitoring setting

- Value range: [100, 20000]. The default value is the same as the SQL threshold configured in the system.
- Click Save.
- Click Clone to Other Component.
Figure 9 Cloning the setting to other components
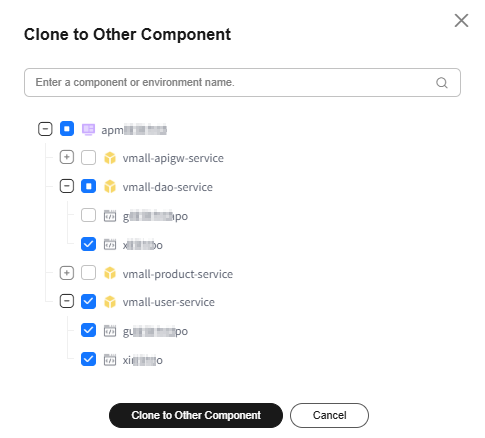
- On the displayed page, select one or more components and click Clone to Other Component. The current database monitoring setting will then be copied to the components you have selected.
Feedback
Was this page helpful?
Provide feedbackThank you very much for your feedback. We will continue working to improve the documentation.See the reply and handling status in My Cloud VOC.
For any further questions, feel free to contact us through the chatbot.
Chatbot


