Enabling Cost Anomaly Detection to Identify Anomalies
Cost Anomaly Detection uses machine learning to analyze your historical pay-per-use and yearly/monthly expenditures, establish a specific expenditure model for you, and identify root causes for cost surprises based on forecasted amounts. With simple steps, Cost Anomaly Detection helps you quickly take action based on detected cost anomalies to keep to your original plan.
Example
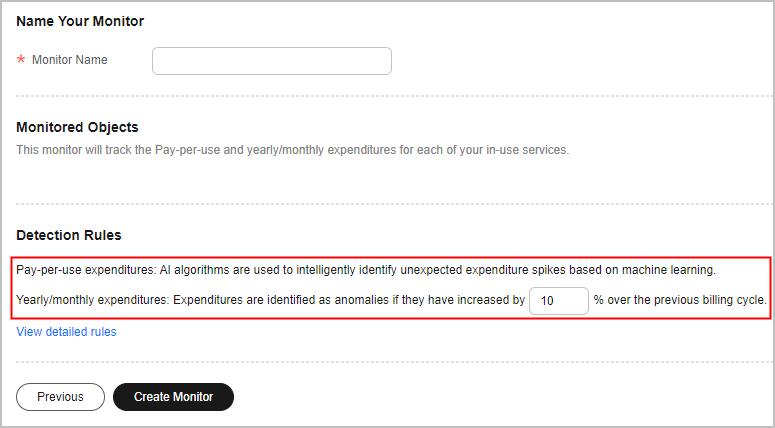
Suppose you want to track anomalies in all your pay-per-use and yearly/monthly expenditures. The following detection rules apply:
- Pay-per-use expenditures: AI algorithms are used to intelligently identify unexpected expenditure spikes based on machine learning.
- Yearly/monthly expenditures: A cost anomaly is identified if the actual growth rate has increased by a certain percent over the previous billing cycle. Actual growth rate = (Actual cost for the current month – Cost for the previous month)/Cost for the previous month

You can create monitors to monitor your costs by linked account, cost tag, or cost category as needed.
Step 1: Creating a Monitor
- Access the Cost Anomaly Detection page.
- Click Create Monitor.
- Select All Services.

- Configure detection rules.
Step 2: Viewing Anomaly History
- Access the Cost Anomaly Detection page.
- Click the Cost Monitors tab.
- View the cost anomalies reported. In the example shown in the following figure, one MTD anomaly has been reported.
To view all reported anomalies, click View Anomaly History in the Operation column of the monitor.

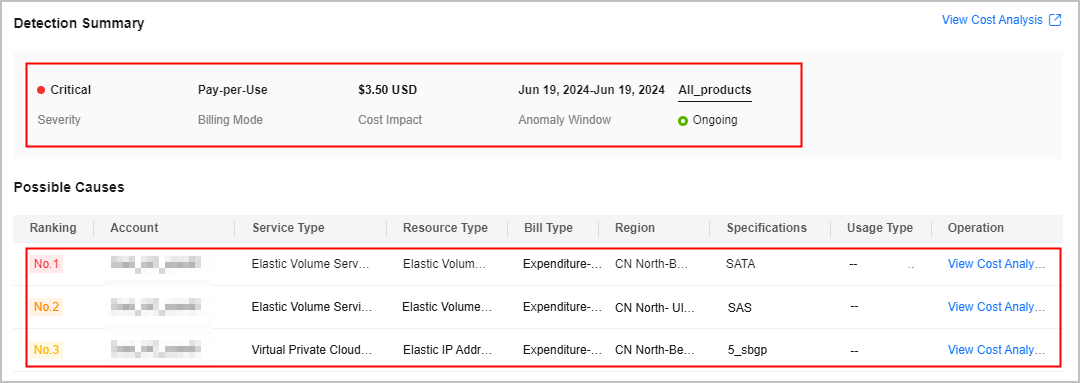
- View the anomaly details. In this example, a cost anomaly in a yearly/monthly subscription was detected on June 20, 2024. The impact of this anomaly was $3.50 USD, mainly involving Elastic Volume Service (EVS).
To view details about cost anomalies and the analyses of potential root causes, click the hyperlink of a specific detection date.

- View the top 3 services that may cause the anomaly.
Step 3: Analyzing Causes of Cost Anomalies
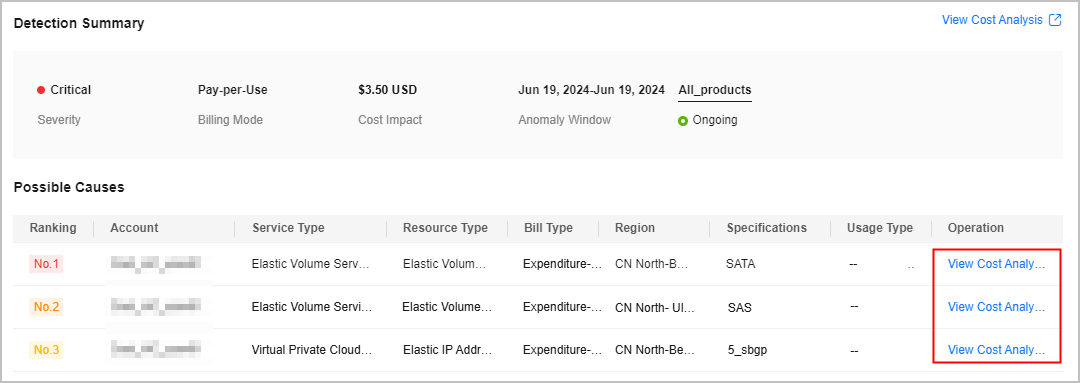
- Access the Anomaly Details page, locate a possible cause and click View Cost Analysis in the Operation column.
- Navigate to the Cost Analysis page. Selected filters are automatically displayed.
In this example, a new purchase order line was generated for Elastic Volume Service (EVS) on June 03, 2024, costing $3.50 USD. You need to check whether the new purchase was identified as an anomaly.
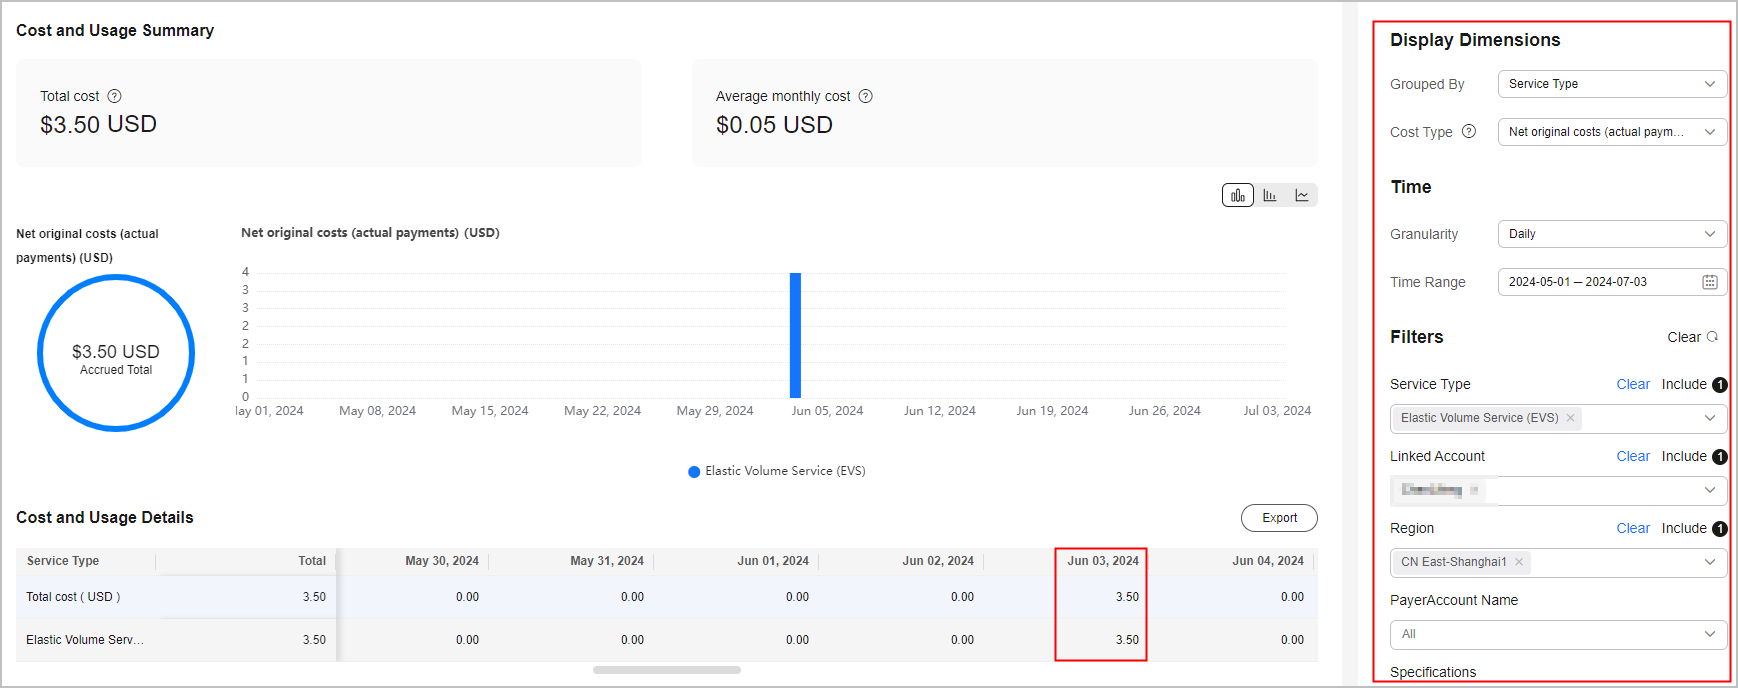
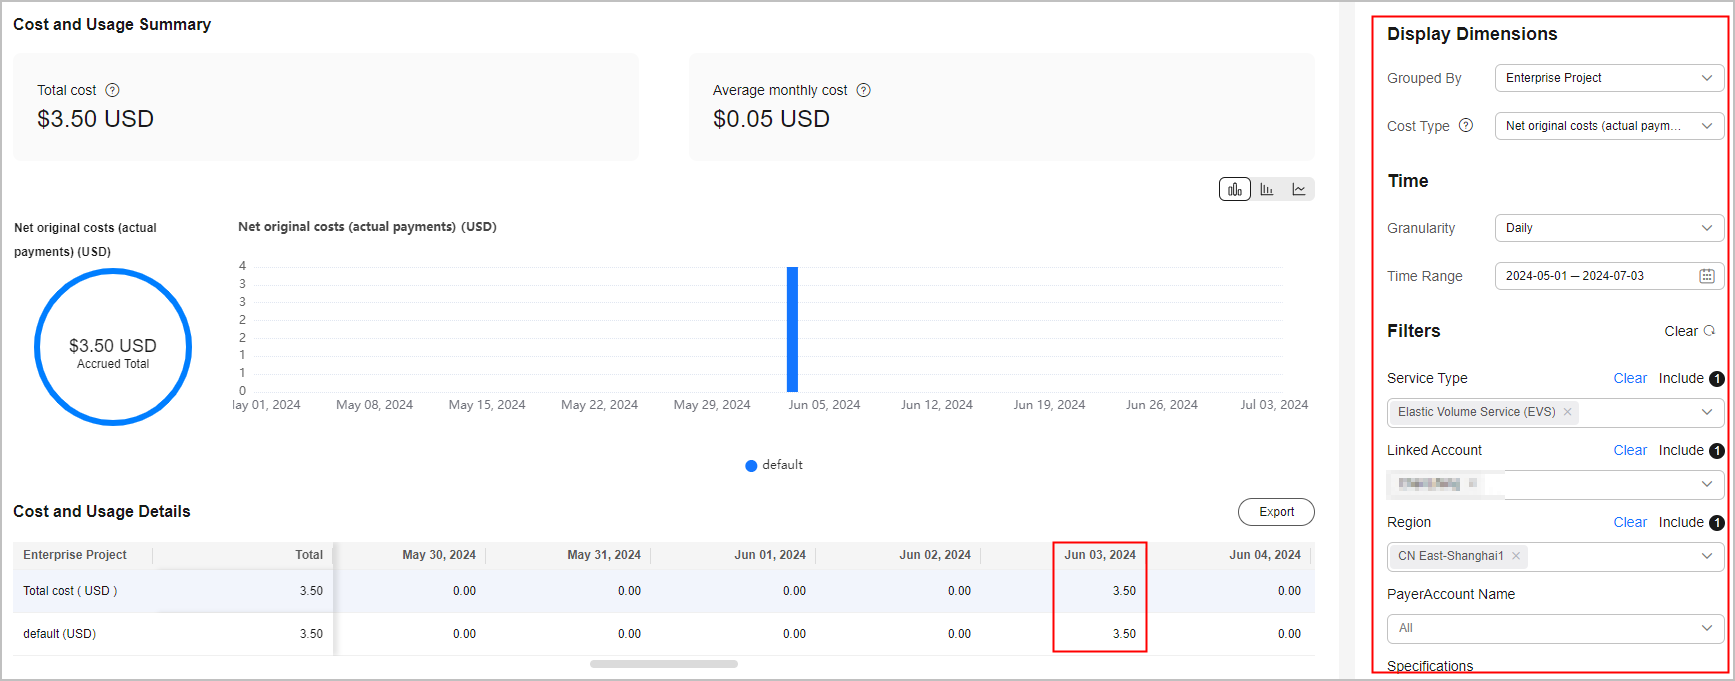
- Group costs by Enterprise Project to view those enterprise projects involving cost anomalies.
In this example, the new purchase (costing $3.50 USD) for Elastic Volume Service (EVS) on June 03, 2024 was not allocated to any specific enterprise project.
Feedback
Was this page helpful?
Provide feedbackThank you very much for your feedback. We will continue working to improve the documentation.See the reply and handling status in My Cloud VOC.
For any further questions, feel free to contact us through the chatbot.
Chatbot


