
(New) Using Prometheus to Monitor ECS Metrics
An Elastic Cloud Server (ECS) is a computing server consisting of the CPU, memory, OS, and Elastic Volume Service (EVS) disk. It supports on-demand allocation and auto scaling. ECSs integrate Virtual Private Cloud (VPC), security group, and Cloud Firewall (CFW) capabilities to create an efficient, reliable, and secure computing environment. This ensures stable and uninterrupted running of services. AOM is a one-stop, multi-dimensional O&M platform for cloud applications. It enables you to monitor real-time running of applications, resources, and services and detect faults in a timely manner, improving O&M automation capability and efficiency. After an ECS is connected to AOM, AOM can monitor the ECS in real time and send alarm notifications.
This section uses the node_network_up metric of an ECS as an example to describe how to use AOM.
Constraints
The ECS must be in the same region as the AOM console.
Procedure
- Installing UniAgent on the ECS: Install UniAgent on the host in the region where the AOM console is located to centrally manage metric collection plug-ins.
- Creating a Host Group: Create a host group for better host management and more efficient data collection.
- Connecting an ECS to AOM: Connect an ECS to AOM. Then you can install Node Exporter and configure collection tasks for the host group. The collected metrics will be stored in the Prometheus instance for ECS for easy management.
- Setting a Metric Alarm Rule: Create an alarm rule for the ECS metric. If the metric data meets the alarm condition, an alarm will be generated.
Prerequisites
- You have purchased an ECS. For details, see Purchasing and Using a Linux ECS. If you already have an ECS, skip this step.
- You have subscribed to AOM 2.0 and granted permissions.
Installing UniAgent on the ECS
- Log in to the AOM 2.0 console.
- In the navigation pane, choose Settings > Global Settings.
- On the displayed page, choose Collection Settings > UniAgents and click Try New Version in the upper right corner of the page.
- On the displayed page, check the UniAgent status of the ECS.
- If the UniAgent status is Running, UniAgent has been installed. In this case, go to Creating a Host Group.
- If the UniAgent status is Offline, UniAgent is abnormal.
- If the UniAgent status is Installing, UniAgent is being installed. Wait for UniAgent installation.
- If the UniAgent status is Installation failed or Not installed, UniAgent fails to be installed or is not installed on the host. In this case, install it.
- On the ECS tab page, click Install UniAgent and then select the Install via Script (Recommended) scenario.
- On the Install UniAgent page, set parameters.
Figure 1 Installing UniAgent
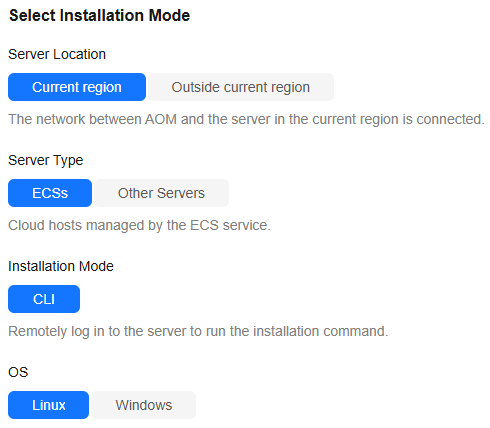
Table 1 Installation parameters Parameter
Description
Example
Server Region
Options: Current region and Outside current region. In this example, select Current region.
Current region: The network between AOM and the server in the current region is connected.
Current region
Server Type
Options: ECSs and Other Servers. Select ECSs.
ECSs: hosts managed by the ECS service.
ECSs
Installation Mode
Option: CLI.
You need to remotely log in to the server to run the installation command provided on the console.
CLI
OS
Options: Linux and Windows. Select Linux in this example.
Linux
UniAgent Version
Select a UniAgent version. The latest version is selected by default.
Latest version
Copy and Run Installation Command
Click Copy to copy the installation command.
Copy the Linux installation command.
- Log in to the ECS and run the Linux installation command copied in 6 as the root user.
- Check the UniAgent status in the UniAgent list. If the UniAgent status is Running, the installation is successful.
Creating a Host Group
You can create host groups of the IP address and custom identifier types. In this example, select the IP address type.
- Log in to the AOM 2.0 console.
- In the navigation pane, choose Settings > Global Settings.
- On the Global Settings page, choose Collection Settings > Host Groups and click Create Host Group.
- On the displayed page, set related parameters.
Table 2 Parameters Parameter
Description
Example
Host Group
Name of a host group. Enter 1 to 64 characters. Do not start with a period (.) or underscore (_) or end with a period. Only letters, digits, hyphens (-), underscores, and periods are allowed.
aom-ecs
Host Group Type
Type of the host group. Options: IP and Custom identifier. In this example, select IP.
IP
Host Type
Host type. Default: Linux.
Linux
Remark
Host group remarks. Enter up to 1,024 characters. In this example, leave this parameter blank.
-
- In the host list, select one or more hosts to add to the group and click OK.
Connecting an ECS to AOM
- Log in to the AOM 2.0 console.
- In the navigation pane, choose Access Center > Access Center. Click Try New Version in the upper right corner of the page.
- Locate the Elastic Cloud Server (ECS) card under Running environments and click Ingest Metric (AOM) on the card.
- Set parameters for connecting to the ECS.
- Select a Prometheus instance.
- Instance Type: Select a Prometheus instance type. Options: Prometheus for ECS and Common Prometheus instance.
- Instance Name: Select a Prometheus instance from the drop-down list. If no Prometheus instance is available, click Create Instance. For details, see Table 3.
Table 3 Creating a Prometheus instance Parameter
Description
Example
Instance Name
Prometheus instance name.
Enter a maximum of 100 characters and do not start or end with an underscore (_) or hyphen (-). Only letters, digits, underscores, and hyphens are allowed.
mon_ECS
Enterprise project.
Select the required enterprise project. The default value is default.- If you have selected All for Enterprise Project on the global settings page, select one from the drop-down list here.
- If you have already selected an enterprise project on the global settings page, this option will be grayed and cannot be changed.
default
Instance Type
Type of the Prometheus instance. Options: Prometheus for ECS and Common Prometheus instance.
Prometheus for ECS
- Select a host group.
In the host group list, select the host group created in Creating a Host Group.
- Configure the collection.
Under Configure Collection, set parameters by referring to the following table.
Table 4 Collection configuration Category
Parameter
Description
Example
Basic Settings
Configuration Name
Name of a metric ingestion rule.
Enter up to 50 characters starting with a letter. Only letters, digits, underscores (_), and hyphens (-) are allowed.
ecs-rule
Metric Collection Rule
Metric Collection Interval (s)
Interval for collecting metrics, in seconds. Options: 10, 30, and 60 (default).
60
Metric Collection Timeout (s)
Timeout period for executing a metric collection task, in seconds. Options: 10, 30, and 60 (default). The timeout period cannot exceed the collection interval.
60
Executor
User who executes the metric ingestion rule, that is, the user of the selected host group. Default: root.
root
Other
Custom Dimensions
Dimensions (key-value pairs) added to specify additional metric attributes. You can click Add Dimension to add multiple custom dimensions (key-value pairs). In this example, leave this parameter blank.
-
Import ECS Tags as Dimensions
This function is disabled by default. If it is enabled, ECS tags (key-value pairs) will be written to metric dimensions and tag changes will be synchronized to AOM.
Disable
- Select a Prometheus instance.
- After the configuration is complete, click Next. The ECS metrics can then be ingested.
Setting a Metric Alarm Rule
Metric alarm rules can be created in the following modes: Select from all metrics and PromQL.
The following describes how to create an alarm rule when Configuration Mode is set to Select from all metrics.
- In the navigation pane, choose Alarm Center > Alarm Rules. Then, click Create Alarm Rule.
- Set basic information about the alarm rule by referring to Table 5.
Table 5 Basic information Parameter
Description
Example
Original Rule Name
Name of a rule. Enter a maximum of 256 characters and do not start or end with underscores (_) or hyphens (-). Only letters, digits, underscores, and hyphens are allowed.
monitor_ecs
Rule Name
Name of a rule. Enter a maximum of 256 characters and do not start or end with underscores (_) or hyphens (-). Only letters, digits, underscores, and hyphens are allowed.
-
Enterprise Project
Select the required enterprise project. The default value is default.- If you have selected All for Enterprise Project on the global settings page, select one from the drop-down list here.
- If you have already selected an enterprise project on the global settings page, this option will be grayed and cannot be changed.
default
Description
Description of the rule. Enter up to 1,024 characters. In this example, leave this parameter blank.
-
- Set the detailed information about the alarm rule.
- Rule Type: Metric alarm rule.
- Configuration Mode: Select from all metrics. Then you can set alarm conditions for different types of resources.
- Select the target Prometheus instance from the drop-down list. In this example, select the instance created in 4.a.ii.
- Set alarm rule details. Table 6 describes the parameters.
After the setting is complete, the monitored metric data is displayed in a line graph above the alarm conditions. You can click Add Metric to add more metrics and set the statistical period and detection rules for them.
Figure 2 Setting alarm rule details
Table 6 Alarm rule details Parameter
Description
Example
Multiple Metrics
Calculation is performed based on the preset alarm conditions one by one. An alarm is triggered when one of the conditions is met.
Multiple Metrics
Metric
Metric to be monitored. Click the Metric text box. In the resource tree on the right, select a target metric by resource type.
node_network_up
Statistical Period
Interval at which metric data is collected.
1 minute
Conditions
Metric monitoring scope. If this parameter is left blank, all resources are covered. In this example, leave this parameter blank.
-
Grouping Condition
Aggregate metric data by the specified field and calculate the aggregation result.
Not grouped
Rule
Detection rule of a metric alarm, which consists of the statistical mode (Avg, Min, Max, Sum, and Samples), determination criterion (≥, ≤, >, and <), and threshold value.
Avg > 1
Trigger Condition
When the metric value meets the alarm condition for a specified number of consecutive periods, a metric alarm will be generated.
3
Alarm Severity
Severity of a metric alarm.
 : a critical alarm.
 : a major alarm.
 : a minor alarm.
 : a warning.

- Click Advanced Settings and set information such as Check Interval and Alarm Clearance. For details about the parameters, see Table 7.
Table 7 Advanced settings Parameter
Description
Example
Check Interval
Interval at which metric query and analysis results are checked.
Custom interval: 1 minute
Alarm Clearance
The alarm will be cleared when the alarm condition is not met for a specified number of consecutive periods.
1
Action Taken for Insufficient Data
Action to be taken if there is no or insufficient metric data within the monitoring period. Enable this option if needed.
Enabled: If the data is insufficient for 1 period, the status will change to Insufficient data and an alarm will be sent.
Tags
Click
 to add an alarm rule tag. It is an alarm identification attribute in the format of "key:value". It is used in alarm noise reduction scenarios. In this example, leave this parameter blank.
For details, see Alarm Tags and Annotations.
-
Annotations
Click
 to add an alarm rule annotation. It is an alarm non-identification attribute in the format of "key:value". It is used in alarm notification and message template scenarios. In this example, leave this parameter blank.
For details, see Alarm Tags and Annotations.
-
- Set an alarm notification policy. For details, see Table 8.
Figure 3 Setting an alarm notification policy

Table 8 Alarm notification policy parameters Parameter
Description
Example
Notify When
Set the scenario for sending alarm notifications. By default, Alarm triggered and Alarm cleared are selected.
- Alarm triggered: If the alarm trigger condition is met, the system sends an alarm notification to the specified personnel by email or SMS.
- Alarm cleared: If the alarm clearance condition is met, the system sends an alarm notification to the specified personnel by email or SMS.
Retain the default value.
Alarm Mode
- Direct alarm reporting: An alarm is directly sent when the alarm condition is met. If you select this mode, set an interval for notification and specify whether to enable a notification rule.
- Frequency: frequency for sending alarm notifications. Select a desire value from the drop-down list.
- Notification Rule: After the rule is enabled, the system sends notifications based on the associated SMN topic and message template. If there is no alarm notification rule you want to select, click Add Rule in the drop-down list to create one. For details about how to set alarm notification rules, see Setting an Alarm Notification Rule.
- Alarm Mode: Select Direct alarm reporting.
- Frequency: Select Once.
- Notification Rule: Mon_aom
- Click Confirm. Then click View Rule to view the created rule.
In the expanded list, if a metric value meets the configured alarm condition, a metric alarm is generated on the alarm page. To view the alarm, choose Alarm Center > Alarm List in the navigation pane. If a metric value meets the preset notification policy, the system sends an alarm notification to the specified personnel by email or SMS.
Figure 4 Creating a metric alarm rule
Related Information
After an alarm rule is configured, you can perform the following operations if needed:
- Choose Alarm Center > Alarm List to check alarms. For details, see Checking AOM Alarms or Events.
- Create metric alarm rules in different ways. For details, see Creating an AOM Metric Alarm Rule.
Feedback
Was this page helpful?
Provide feedbackThank you very much for your feedback. We will continue working to improve the documentation.See the reply and handling status in My Cloud VOC.
For any further questions, feel free to contact us through the chatbot.
Chatbot


