
Resource Reconciliation
Live can check whether a bill is consistent with the actual resource usage.
Checking the Consistency of the Actual Usage and Billed Usage
To check whether the usage of Live is consistent with that in bills, log in to the Live console, choose in the navigation pane, and check the billing option on the right. The following table lists whether a billing mode supports Live usage check and the check methods.
|
Billing Option |
Usage Type |
Usage Check Method |
|---|---|---|
|
Billing by traffic |
Traffic |
|
|
Billing by daily peak bandwidth |
Daily peak bandwidth |
|
|
Billing by 95th percentile bandwidth |
95th percentile bandwidth |
Usage cannot be checked by enterprise project, domain name, or tag. For details about how to split costs by enterprise project, domain name, or tag, see Enabling Cost Splitting. |
|
Value-added service |
Cloud Live transcoding: You are billed based on the encoding standard, output resolution, and output duration. |
The methods for checking the usage are the same for all value-added services. See Checking the Resource Usage – Live Snapshot Capturing Fee. |
|
Cloud Live recording: The number of concurrent recording streams is calculated every day and the peak value in the current month is used as the billing point. |
||
|
Cloud Live snapshot capturing: You are billed based on the number of snapshots. |
Checking the Resource Usage – Traffic-based Billing
- Log in to the Live console and choose Service Monitoring. The Downstream Bandwidth/Traffic tab page is displayed by default. Set the parameters for querying the traffic usage as follows:
- Time: Select Custom and set the time to 2023/08/21 11:00:00 - 2023/08/21 11:59:59.
- Domain name: Select a Live domain name of the current region (CN North-Beijing4).
- Region: Select China.
- Province: Select All provinces/states.
- Carrier: Select All carriers.
- Application name: No setting is required.
- Stream name: No setting is required.
- Interval: Select Every 5 minutes.
- Protocol: Select All Protocols.
- Select Traffic in the right pane. As shown in Figure 1, the resource usage is 187.08 MB.
Convert MB to GB and round the conversion result to three decimal places. The converted value is 0.1827 GB (187.08 MB/1024).
You can also click
 on the right of the page to download the queried downstream traffic result to your local PC.
 - Go to Billing Center, choose Billing > Transactions and Detailed Bills in the navigation pane, and click Bill Details.
Set Settings to Usage, Data Period to Details, Service Type to Live (Live), and Resource Type to Live CDN Flow.
The resource usage from 11:00 to 12:00 on August 21, 2023 is 0.1827 GB, as shown in the following figure.
Figure 2 Resource usage shown in Billing Center
- Since Billing Center's billing unit for Live CDN traffic is GB, compare the resource usage shown in Billing Center with the converted value obtained in step 2. They are the same. The usage check is complete.

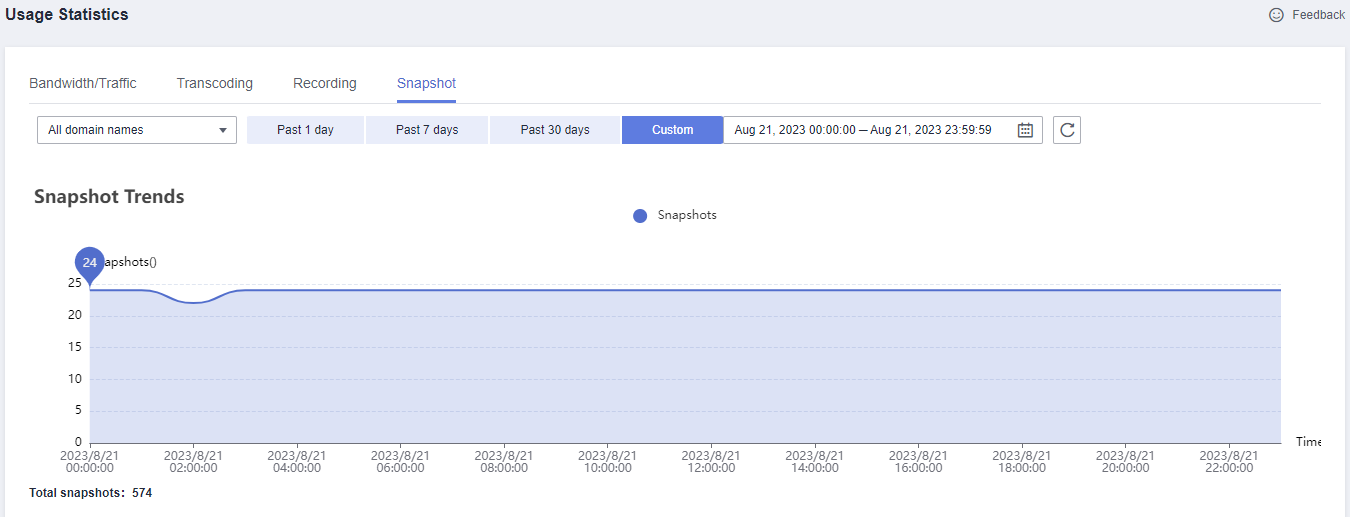
Checking the Resource Usage – Live Snapshot Capturing Fee
- Log in to the Live console and select CN North-Beijing4.
- Choose Usage Statistics in the left navigation pane, click the Snapshot tab, and set the parameters as follows:
- Domain name: Select All domain names.
- Time: Select Custom and set the time to 2023/08/21 00:00:00 - 2023/08/21 23:59:59.
- The total number of snapshots is 574, as shown in the trend chart in Figure 3.
Convert the unit to 1000 and the converted value is 0.574 (574/1000).
- Go to Billing Center, choose Billing > Transactions and Detailed Bills in the navigation pane, and click Bill Details.
Set Settings to Usage, Data Period to By day, Service Type to Live (Live), and Resource Type to Live Snapshot.
The number of snapshots in CN North-Beijing4 on August 21, 2023 is 0.574k, as shown in the following figure.
Figure 4 Snapshot quantity shown in Billing Center
- Since Billing Center's billing unit for Live snapshot capturing is thousand, compare the snapshot quantity shown in Billing Center with the converted value obtained in step 2. They are the same. The quantity check is complete.
Feedback
Was this page helpful?
Provide feedbackThank you very much for your feedback. We will continue working to improve the documentation.See the reply and handling status in My Cloud VOC.
For any further questions, feel free to contact us through the chatbot.
Chatbot


