
Usage Statistics
You can check the downstream bandwidth/traffic of all streaming domain names, and the total transcoding duration, maximum number of concurrent recording streams, and number of snapshots of all ingest domain names.
About Query
- You can query bandwidth/traffic data of the past 24 hours.
- You can query transcoding/recording/snapshot data of the past 90 days. The maximum query time span is 31 days.
Procedure
- Log in to the Live console.
- In the navigation pane, choose Usage Statistics.
- View statistics on the Bandwidth/Traffic, Transcoding, Recording, or Snapshot tab.
Bandwidth/Traffic
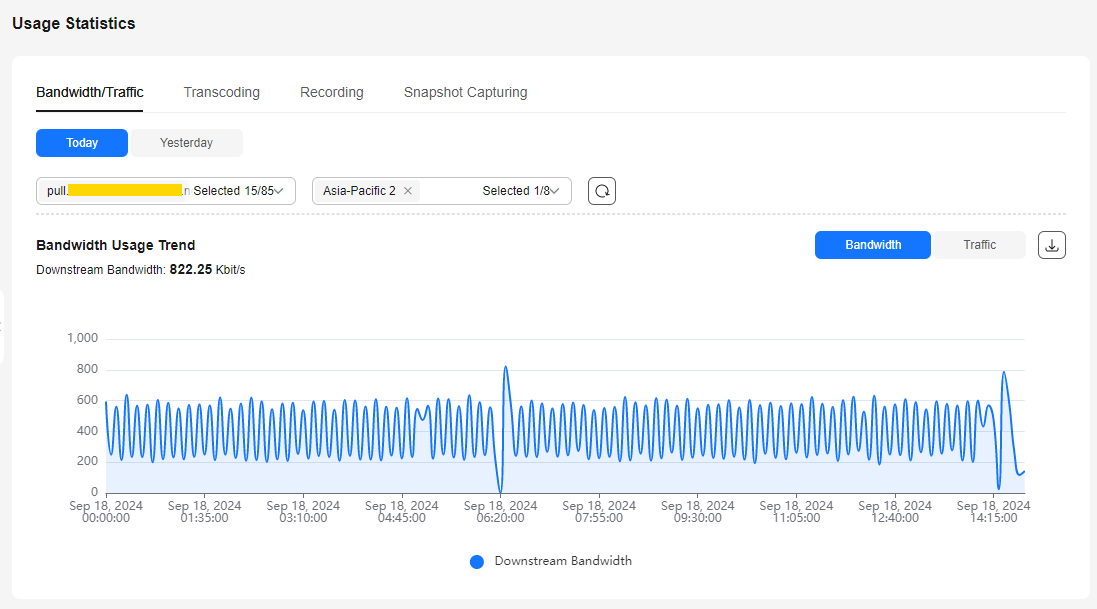
Specify the time, streaming domain name, and billing region to view data in the Bandwidth Usage Trend or Traffic Usage Trend area.
You can click  to export the downstream bandwidth or traffic details.
- Bandwidth Usage Trend displays the bandwidth usage trend of a selected domain name.
You can point to the chart to view the specific value or scroll the mouse wheel to zoom in or out on the X-axis within a time range.Figure 1 Downstream bandwidth trend
- Traffic Usage Trend displays the traffic usage trend of a selected domain name.
You can point to the chart to view the specific value or scroll the mouse wheel to zoom in or out on the X-axis within a time range.Figure 2 Downstream traffic details

Transcoding
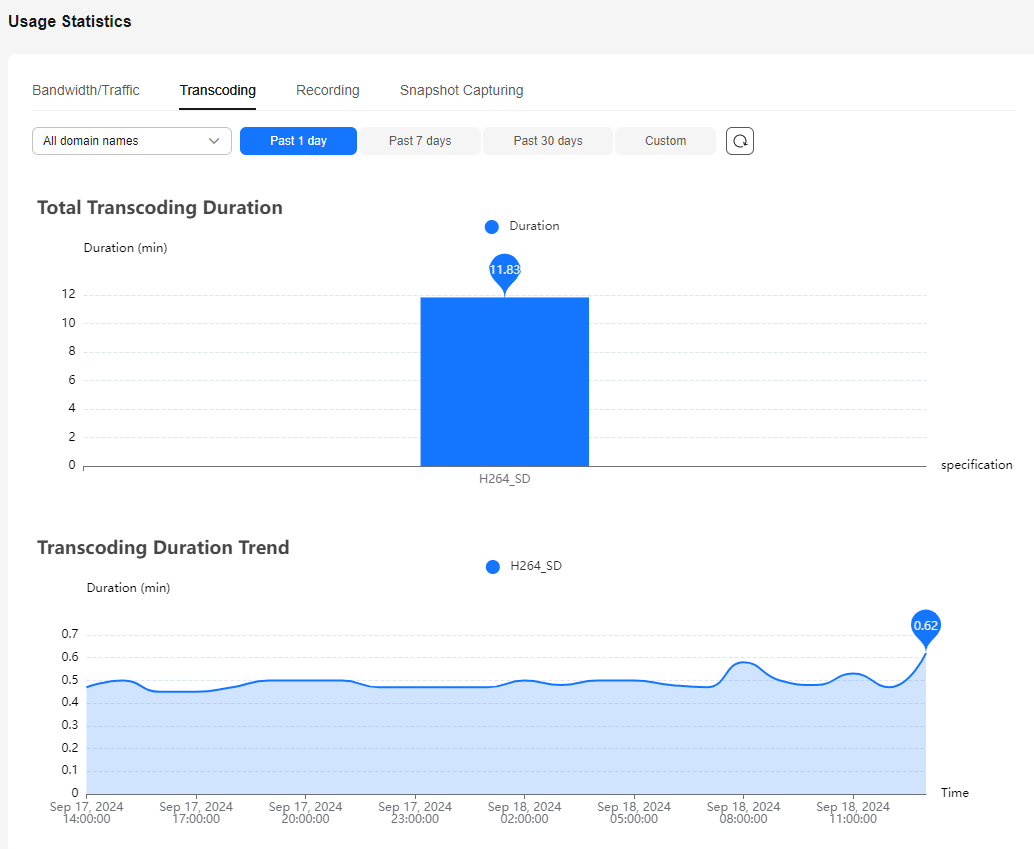
- Total Transcoding Duration displays the total duration of different transcoded outputs of a selected domain name in the query period.
- Transcoding Duration Trend displays the total duration of different transcoded outputs of a selected domain name in the query period.
You can point to the chart to view the specific value or scroll the mouse wheel to zoom in or out on the X-axis within a time range.Figure 3 Transcoding
Recording
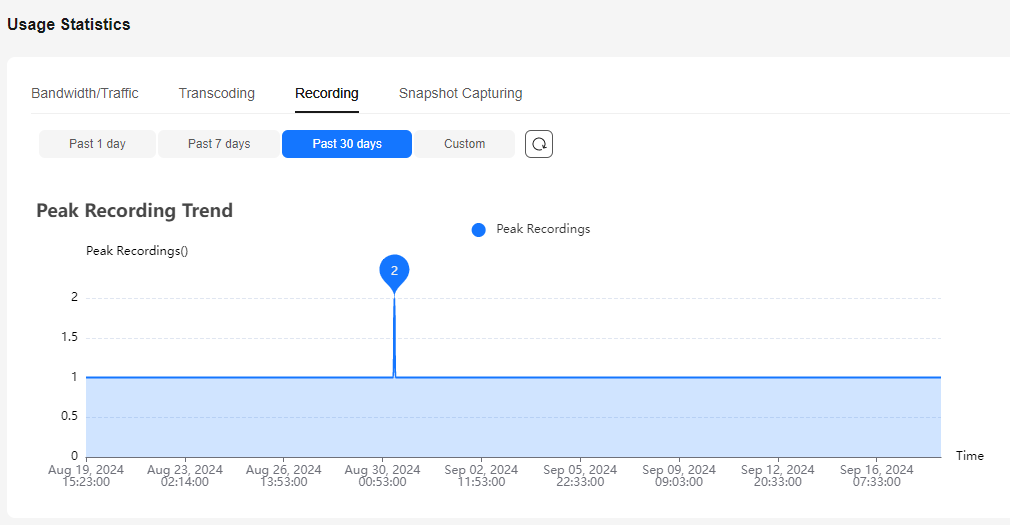
The system collects statistics on the total number of concurrent recording streams every 5 minutes and obtains 12 values every hour. It then uses the maximum value as the number of concurrent recording streams in the hour.
Specify the time to view the peak recording trend.
The peak recording trend area displays the maximum number of recorded concurrent livestreams of an account per hour, as shown in Figure 4.
You can point to the chart to view the specific value or scroll the mouse wheel to zoom in or out on the X-axis within a time range.
You can point to the chart to view the specific value or scroll the mouse wheel to zoom in or out on the X-axis within a time range.
Snapshot
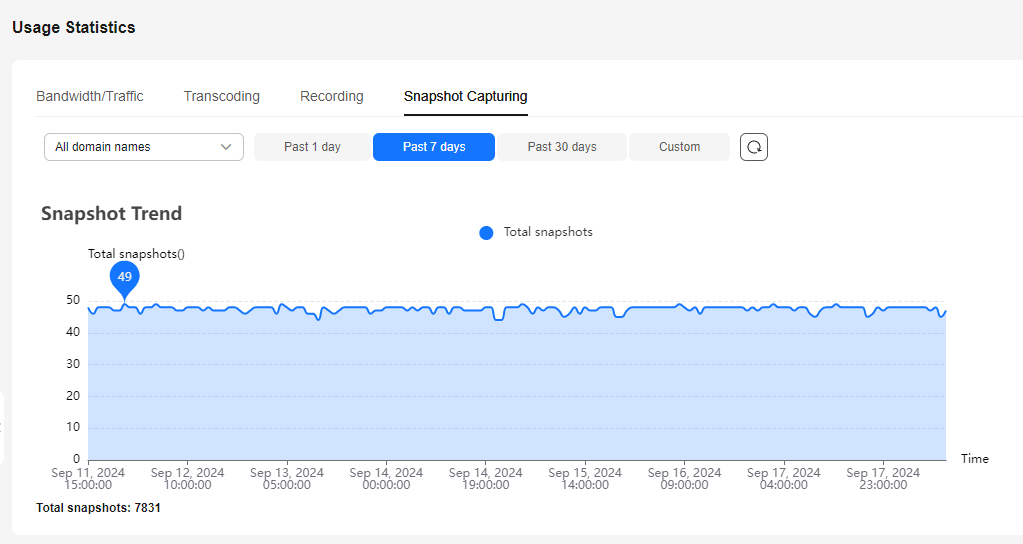
Specify the time and ingest domain name to view the number of snapshots.
The Screenshot Trends area displays the number of snapshots captured for a selected domain name during livestream push, as shown in Figure 5.
Feedback
Was this page helpful?
Provide feedbackThank you very much for your feedback. We will continue working to improve the documentation.See the reply and handling status in My Cloud VOC.
For any further questions, feel free to contact us through the chatbot.
Chatbot


