
Service Monitoring
You can view the downstream bandwidth/traffic, playback profiles, status codes returned in the request response of a streaming domain name, and the number of online viewers of the corresponding livestream. You can also view monitoring information such as the upstream bandwidth/traffic, total number of pushed streams, streaming records, and stream push frame rate/bitrate of an ingest domain name.
Notes
The number system of bandwidth is 1,024. For example, 1 Mbit/s is equal to 1024 Kbit/s.
Procedure
- Log in to the Live console.
- In the navigation pane, choose Service Monitoring.
- Select Downstream Bandwidth/Traffic, Upstream Bandwidth/Traffic, Status Codes, Streams, Pushed Streams, Streaming Records, Stream Playback Profiles, Viewers, or Stream Push Monitoring to view statistics.
Move the cursor to the trend chart and scroll the mouse wheel to zoom in or zoom out the X axis (time).
Downstream Bandwidth/Traffic
Specify the time, streaming domain name, area, app name, stream name, statistical granularity, and packaging protocol. Click Bandwidth or Traffic on the right of the page to view the bandwidth or traffic usage trend.
 on the right to export specific data.

- You can query statistics of the past 365 days.
- You can query statistics in a time span of up to 31 days.
- The minimum statistical granularity is five minutes. For example, data generated from November 6, 2020 08:00:00 (GMT+08:00) to November 6, 2020 08:04:59 (GMT+08:00) is displayed at the statistical point November 6, 2020 08:00:00 (GMT+08:00). The bandwidth uses the average value of the selected statistical granularity, and the traffic uses the accumulated value of the selected statistical granularity.
- The stream name is the name of the stream pulled by the player. For example, if the player pulls a transcoded stream, set the stream name to the name of the transcoded stream.
- The exported data cannot be classified by carrier.
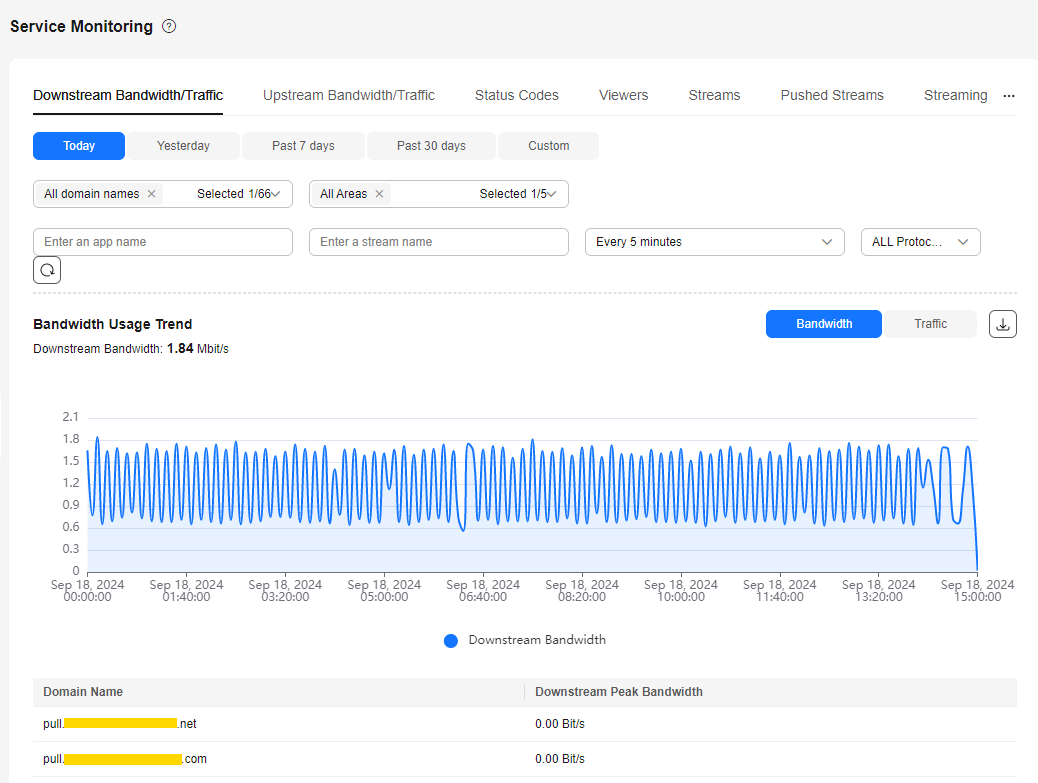
- Bandwidth Usage Trend displays the bandwidth usage trend of the selected domain name. You can also view the downstream peak bandwidth of the selected domain name within the query period below the Bandwidth Usage Trend area, as shown in Figure 1.
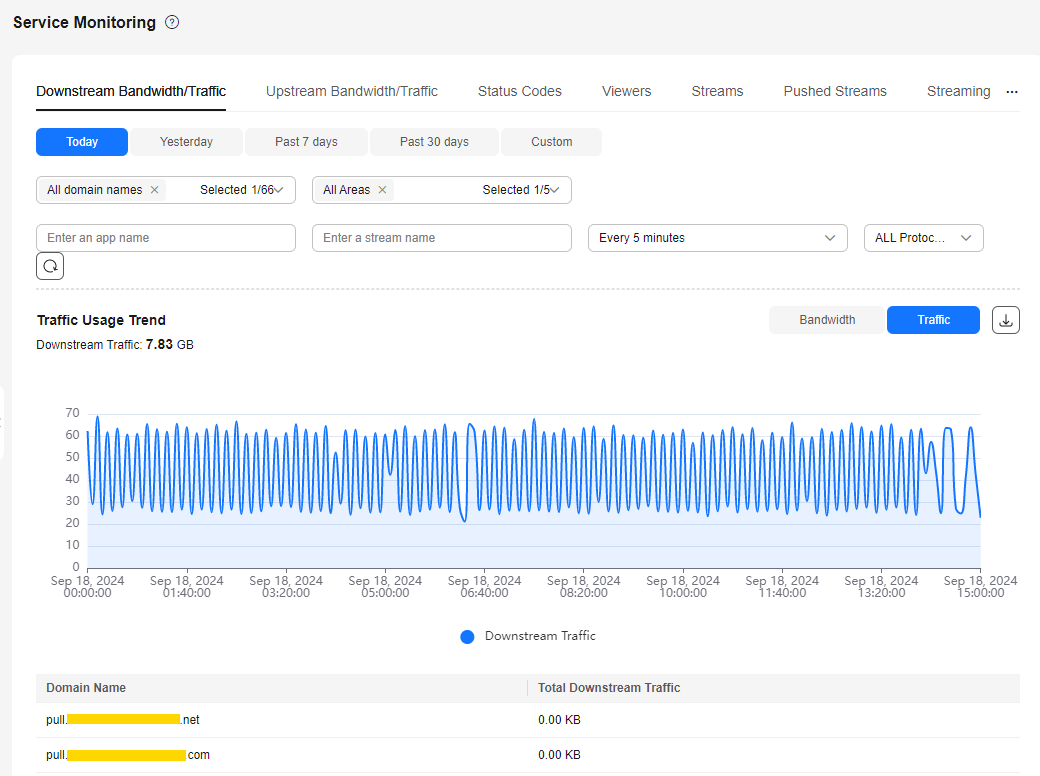
- Traffic Usage Trend displays the traffic usage trend of the selected domain name. You can also view the traffic consumption of the selected domain name within the query period below the Traffic Usage Trend area, as shown in Figure 2.

The total traffic displayed in the traffic table and traffic trend chart is the sum of traffic measured every five minutes and converted from byte into MB, accurate to two decimal places. Therefore, the displayed traffic data may be slightly different from the sum of the values in the Downstream Traffic(MB) column in the exported traffic statistics table. This is because the values are rounded off.
Upstream Bandwidth/Traffic
Specify the time, ingest domain name, area, province/state, carrier, app name, stream name, statistical granularity, and packaging protocol. Click Bandwidth or Traffic on the right of the page to view the bandwidth or traffic usage trend.
You can click  on the right to export specific data.
- You can query statistics of the past 365 days.
- You can query statistics in a time span of up to 31 days.
- The minimum statistical granularity is five minutes. For example, data generated from November 6, 2020 08:00:00 (GMT+08:00) to November 6, 2020 08:04:59 (GMT+08:00) is displayed at the statistical point November 6, 2020 08:00:00 (GMT+08:00). The bandwidth uses the average value of the selected statistical granularity, and the traffic uses the accumulated value of the selected statistical granularity.
- The exported data cannot be classified by carrier.
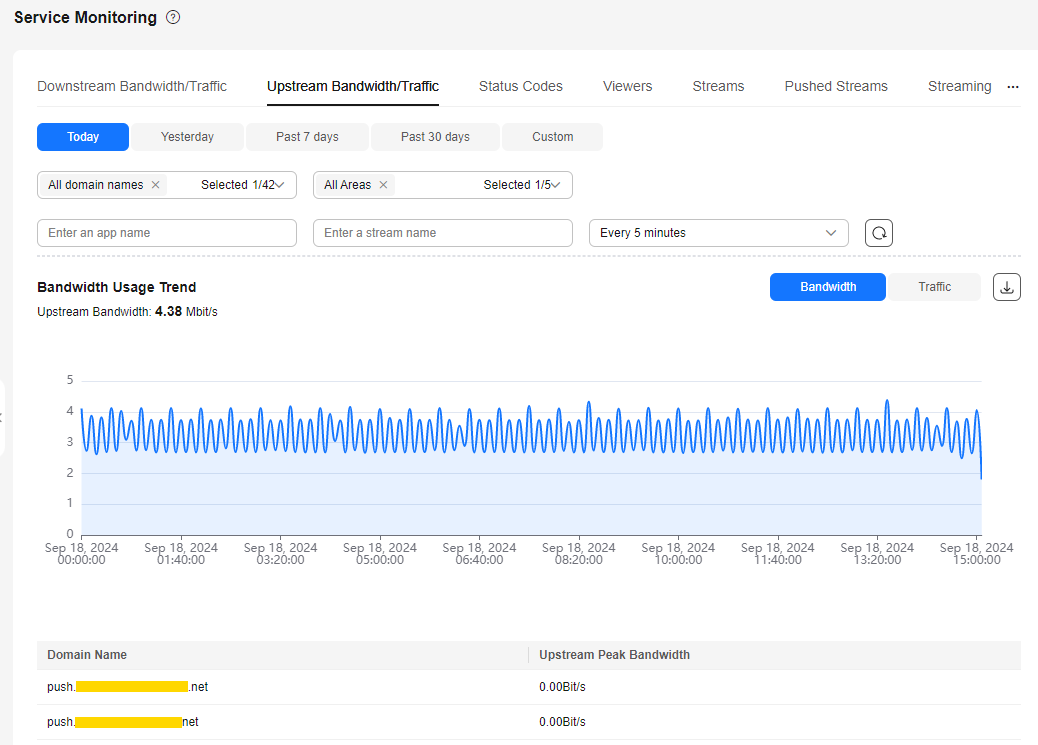
- Bandwidth Usage Trend displays the upstream bandwidth usage trend of the selected domain name, as shown in Figure 3.
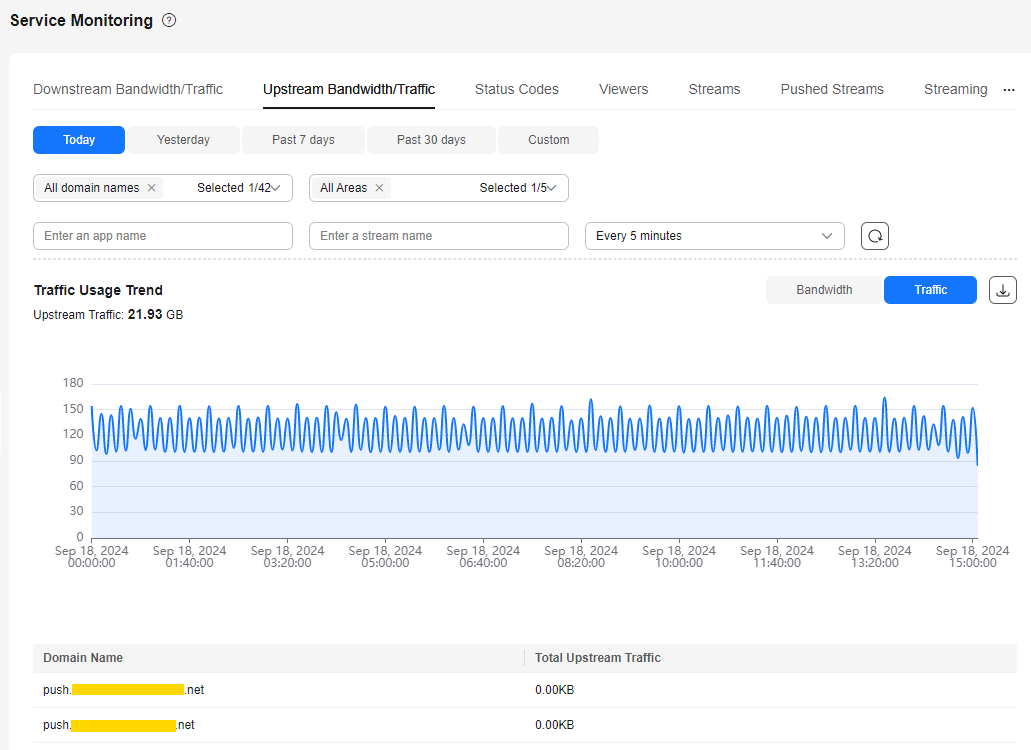
- Traffic Usage Trend displays the traffic usage trend of the selected domain name. You can also view the traffic consumption of the selected domain name within the query period below the Traffic Usage Trend area, as shown in Figure 4.
The total traffic displayed in the traffic table and traffic trend chart is the sum of traffic measured every five minutes and converted from byte into MB, accurate to two decimal places. Therefore, the displayed traffic data may be slightly different from the sum of the values in the Downstream Traffic(MB) column in the exported traffic statistics table. This is because the values are rounded off.
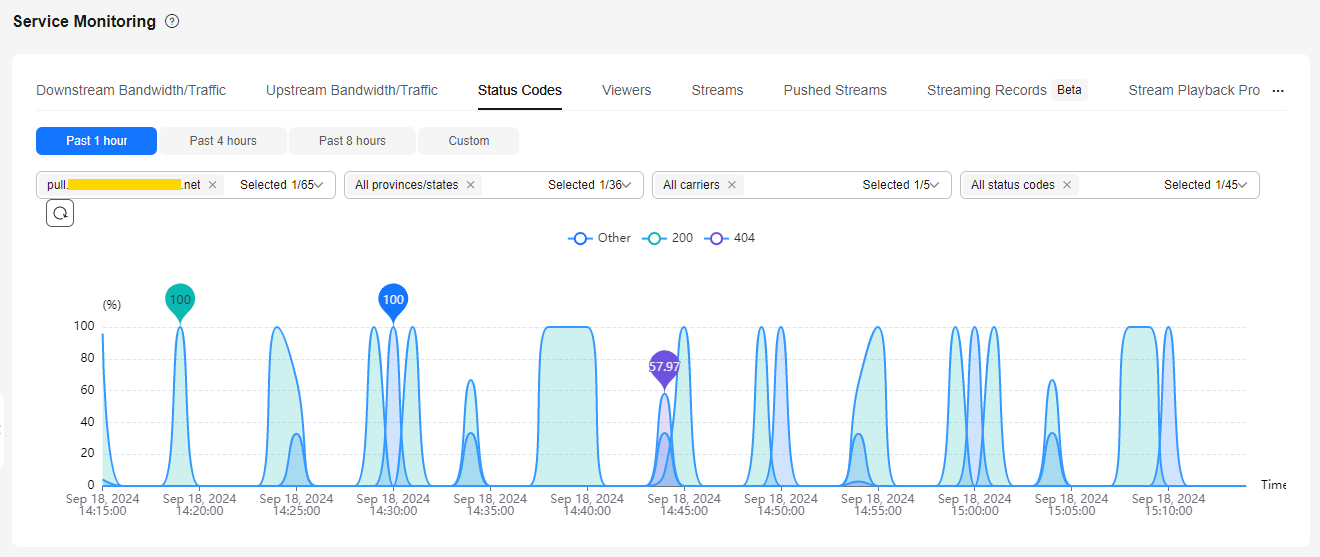
Status Codes
Specify the time, domain name, province/state, carrier, and status code, as shown in Figure 5.
- You can query statistics of the past seven days.
- You can query statistics in a time span of up to one day.
- You can query statistics about up to 10 domain names at a time.
- The minimum statistical granularity is one minute. For example, data generated from November 6, 2020 08:00:00 (GMT+08:00) to November 6, 2020 08:00:59 (GMT+08:00) is displayed at the statistical point November 6, 2020 08:00:00 (GMT+08:00).
The trend chart displays the status codes returned by the selected domain name in the query period.
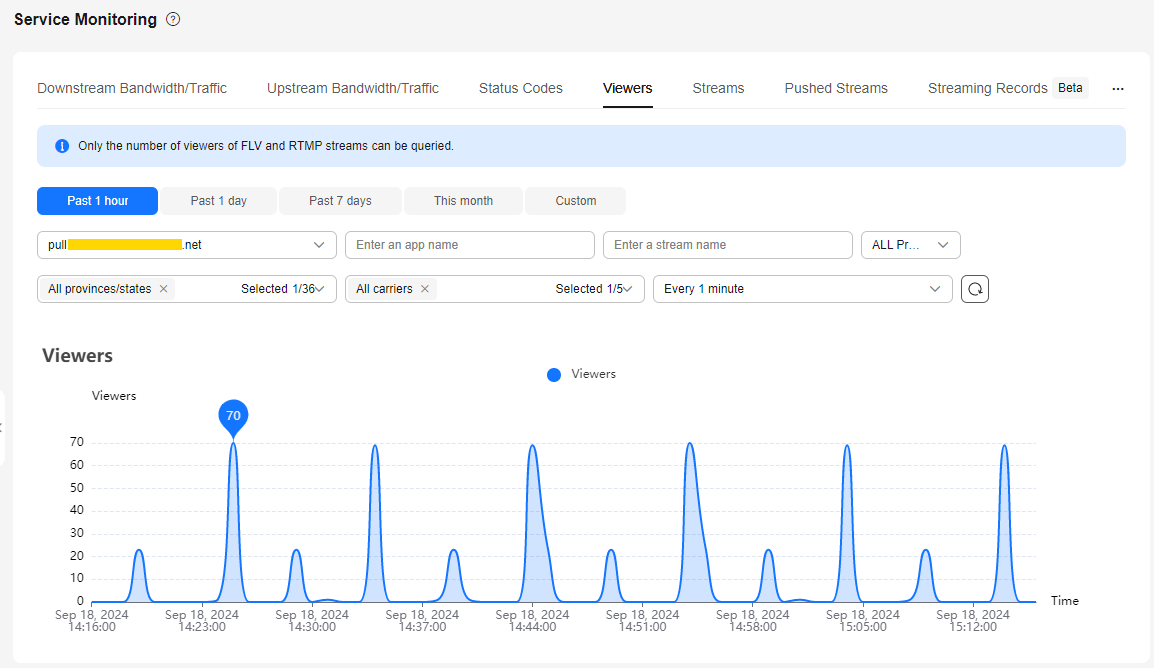
Viewers
Specify the time, streaming domain name, app name, stream name, packaging protocol, province/state, carrier, and statistical granularity.
- Only the number of online users of FLV and RTMP streams can be queried.
- You can query statistics of the past 365 days.
- You can query statistics in a time span of up to 31 days.
- You can query the number of viewers of only one domain name each time.
- The number of viewers is the number of unique IP addresses. The minimum statistical granularity is one minute. For example, data generated from November 6, 2020 08:00:00 (GMT+08:00) to November 6, 2020 08:00:59 (GMT+08:00) is displayed at the statistical point November 6, 2020 08:00:00 (GMT+08:00).
The trend chart displays the online unique viewer trend of the selected domain name, as shown in Figure 6.
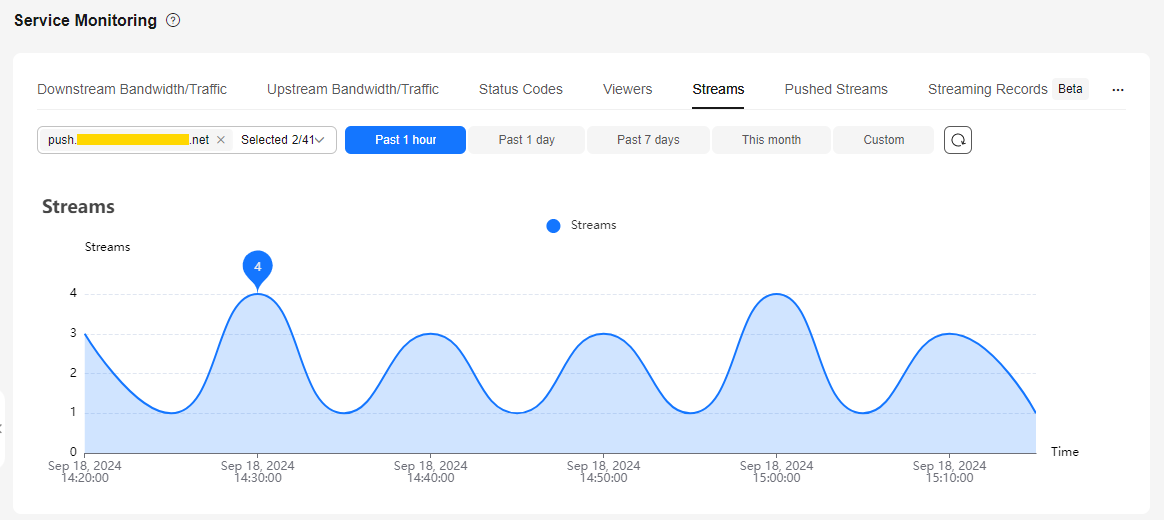
Streams
Specify the ingest domain name and time.
- You can query statistics of the past 365 days.
- You can query statistics in a time span of up to 31 days.
- You can query statistics about up to 10 domain names at a time.
- The minimum statistical granularity is five minutes. For example, data generated from November 6, 2020 08:00:00 (GMT+08:00) to November 6, 2020 08:04:59 (GMT+08:00) is displayed at the statistical point November 6, 2020 08:00:00 (GMT+08:00). The displayed data is the maximum value of the selected statistical granularity.
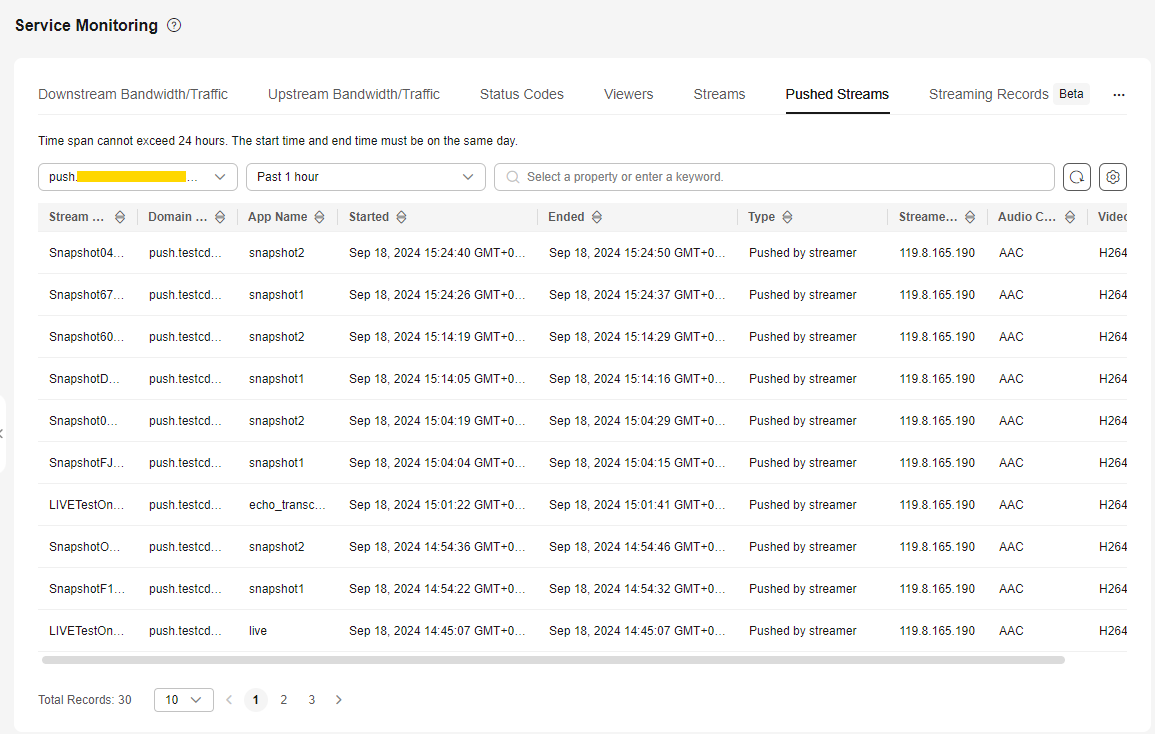
Pushed Streams
Specify the time, ingest domain name, app name, and stream name. Click  to view details about the pushed streams of the ingest domain name, as shown in Figure 8.
- The pushed streams of a domain name that is pushing streams cannot be queried.
- You can query statistics of the past seven days.
- You can query statistics in a time span of up to one day.
|
Parameter |
Description |
|---|---|
|
Stream Name |
Livestream name, that is, the custom value of Stream Name in the ingest URL. |
|
Domain Name |
Ingest domain name. |
|
App Name |
Application name, that is, the default or custom value of App Name in the ingest URL. |
|
Started |
Time when livestream push starts. The format is YYYY-MM-DD hh:mm:ss, for example, 2020-11-06 14:39:42. |
|
Ended |
Time when livestream push ends. The format is YYYY-MM-DD hh:mm:ss, for example, 2020-11-06 14:39:44. |
|
Type |
Stream push type, which can be Pushed by streamer or Pulled from third-party CDN. |
|
Streamer IP |
IP address of the stream push device. |
|
Audio Coding |
Audio codec. |
|
Video Coding |
Video codec. |
Streaming Records
Specify the time, domain name, app name, and stream name. Click  to view the streaming records of the selected domain name, as shown in Figure 9.
Due to a large amount of data, you can query statistics of the past 3 days and in a time span of up to 3 hours.

|
Parameter |
Description |
|---|---|
|
Status |
Stream status.
|
|
Interruption Cause |
Cause for streaming interruption. |
|
Type |
Stream type.
|
|
Domain Name |
Ingest or streaming domain name. |
|
App Name |
Application name, that is, the default or custom value of App Name in the ingest or streaming URL. |
|
Stream Name |
Stream name, that is, the custom value of Stream Name in the ingest or streaming URL. |
|
Started |
Time when the stream starts to be pushed or played. The format is YYYY/MM/DD HH:mm:ss.SSS [GMT]Z, for example, 2023-05-16 14:39:42.629 GMT+08:00. |
|
Ended |
Time when the stream stops being pushed or played. The format is YYYY/MM/DD HH:mm:ss.SSS [GMT]Z, for example, 2023-05-16 14:39:42.629 GMT+08:00. |
|
Client IP |
IP address of the stream push/pull device. |
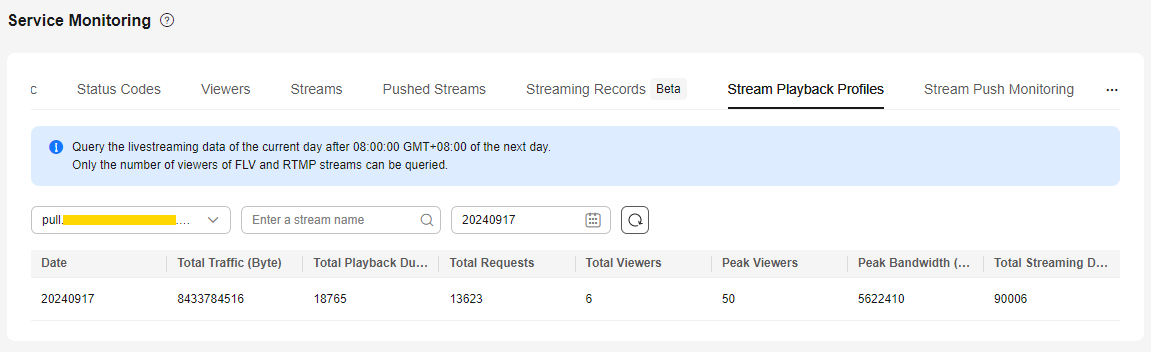
Stream Playback Profiles
Specify the domain name, stream name, and time, as shown in Figure 10.
- You can query statistics of the past 31 days.
- You can query statistics in a time span of up to one day.
- Query the livestreaming data of the current day after 08:00:00 (GMT+08:00) of the next day.
|
Parameter |
Description |
|---|---|
|
Date |
Playback profile information from 00:00 to 23:59 on the selected date is collected. The format is YYYYMMDD, for example, 20201104. |
|
Total Traffic (Byte) |
Total traffic consumed during playback. |
|
Total Playback Duration (s) |
Total playback duration of a video. |
|
Total Requests |
Total number of video playback requests. |
|
Total Viewers |
Total number of viewers. |
|
Peak Viewers |
Peak number of viewers. |
|
Peak Bandwidth (bit/s) |
Peak bandwidth consumed during playback. |
|
Total Streaming Duration (s) |
Total stream push duration. |
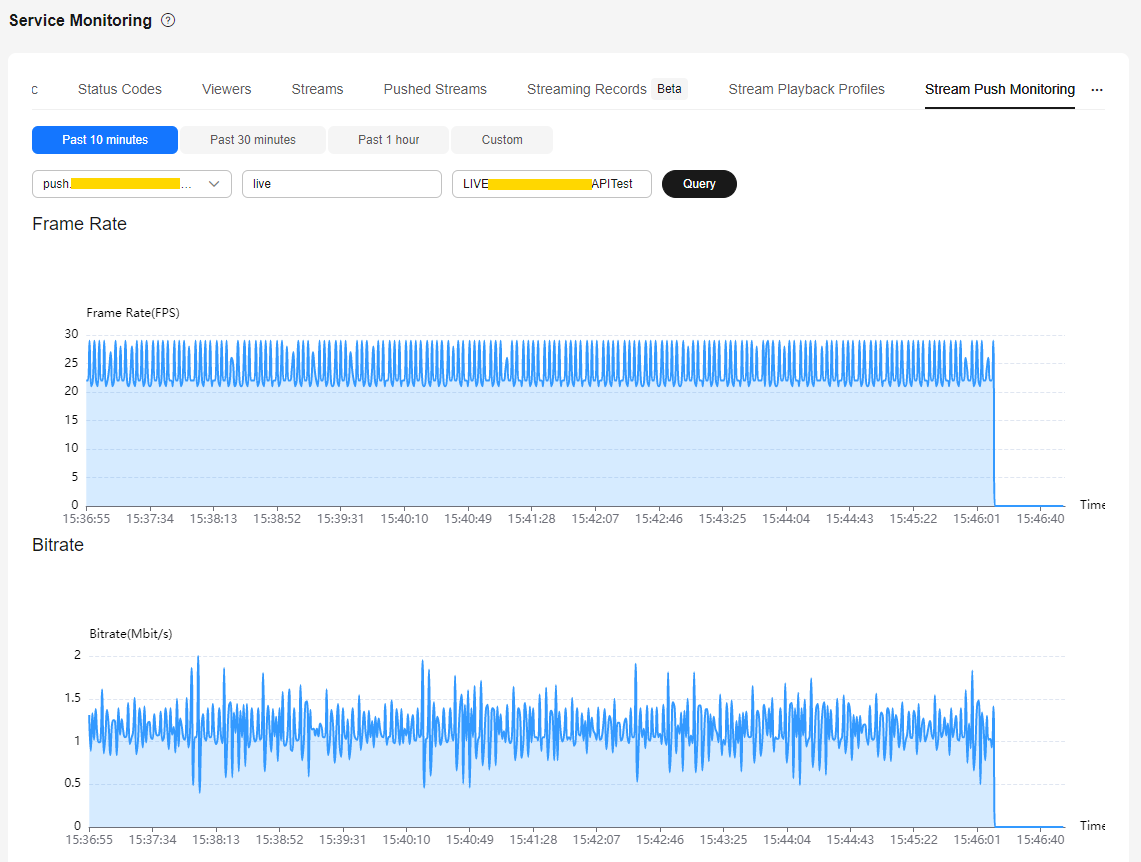
Stream Push Monitoring
Specify the time, ingest domain name, app name, and stream name. Click Query. You can view related data in the Frame Rate and Bitrate areas.
- You can query statistics of the past seven days.
- You can query statistics in a time span of up to 24 hours.
The Frame Rate and Bitrate areas display the trends of the frame rate and bitrate of livestreams (of the selected domain name) pushed to the origin server.
Feedback
Was this page helpful?
Provide feedbackThank you very much for your feedback. We will continue working to improve the documentation.See the reply and handling status in My Cloud VOC.
For any further questions, feel free to contact us through the chatbot.
Chatbot


