Configuring a Recording Rule to Accelerate Metric Query
Based on recording rules, the system calculates the expressions that are frequently used or require heavy calculation in advance and saves the results as a group of new time series. This helps optimize the performance of complex PromQL statements and improve query efficiency. By setting recording rules, you can move the computing process to the write end, reducing resource usage on the query end.
Scenario
Some metrics may require much calculation on the query end, affecting query performance. You can configure recording rules to calculate common or complex metrics in advance. Especially in large-scale clusters and complex service scenarios, recording rules can reduce PromQL complexity, improve metric query performance, and prevent slow configuration and query.
Practice
Configure a recording rule to perform secondary development on metrics. Then view recording rule metrics on the Metric Browsing page.
Configuring a Recording Rule
- Log in to the AOM 2.0 console.
- In the navigation pane on the left, choose Prometheus Monitoring > Instances.
- Click Add Prometheus Instance. For details about the parameters, see Table 1.
Table 1 Parameters for adding a common Prometheus instance Parameter
Description
Example Value
Instance Name
Prometheus instance name.
Enter a maximum of 100 characters and do not start or end with an underscore (_) or hyphen (-). Only letters, digits, underscores, and hyphens are allowed.
mon_AOM
Enterprise Project
Enterprise project.
- If Enterprise Project is set to All on the global settings page, select an enterprise project from the drop-down list here.
- If you have already selected an enterprise project on the global settings page, this option will be grayed and cannot be changed.
default
Instance Type
Type of a Prometheus instance. Only Prometheus instances for CCE and common Prometheus instances support recording rules.
Common Prometheus instance
- Click OK.
- In the Prometheus instance list, click the common Prometheus instance created in 3.
- In the navigation pane on the left, choose Settings. In the Recording Rules area, click Edit RecordingRule.yaml.
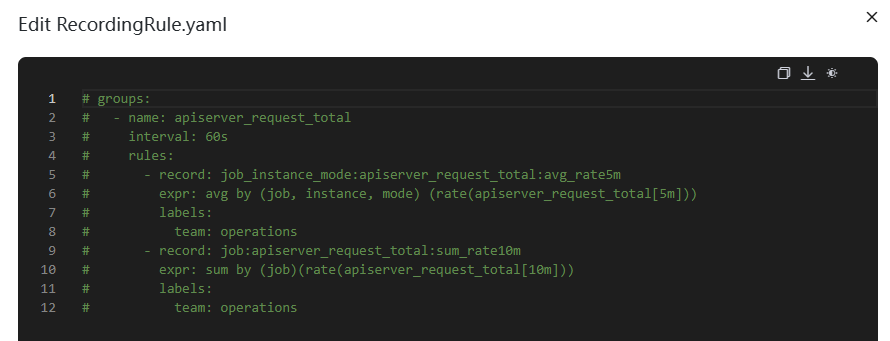
- In the dialog box that is displayed, delete the default content and enter a custom recording rule.
Only one RecordingRule.yaml file needs to be configured for a cluster. Each rule group name must be unique.Figure 1 Configuring a recording rule

Table 2 Recording rule parameters Parameter
Description
groups
Rule group. You can set multiple rule groups in one RecordingRule.yaml file.
name
Rule group name. Each rule group name must be unique.
interval
Execution interval of a rule group. The default value is 60s. (Optional. It is recommended that the execution interval be the same as the metric reporting period.)
rules
Rule. A rule group can contain multiple rules.
record
Rule name. It must comply with Prometheus metric name specifications.
expr
Calculation expression, which is used to calculate metric values. It must comply with PromQL requirements.
labels
(Optional) Metric label. Labels must comply with Prometheus metric label specifications.
Example of a recording rule:
groups: - name: apiserver_request_total interval: 60s rules: - record: apiserver_request_rate expr: avg by (job, instance, mode) (rate(apiserver_request_total[5m])) labels: team: operations - record: job:apiserver_request_total:sum_rate10m expr: sum by (job)(rate(apiserver_request_total[10m])) labels: team: operations - Click OK.
Viewing Recording Rule Metrics
After the recording rule is configured, you can view recording rule metrics on the Metric Browsing page of AOM or through Grafana. The following shows how to view recording rule metrics on the Metric Browsing page of AOM.
Feedback
Was this page helpful?
Provide feedbackThank you very much for your feedback. We will continue working to improve the documentation.See the reply and handling status in My Cloud VOC.
For any further questions, feel free to contact us through the chatbot.
Chatbot


