Cost Allocation and Visualization
After you plan organizational resources and ensure that costs are traceable, you can allocate and visualize cost data so that responsible organizations can know their respective costs in a timely manner.
Cost Allocation Principles
Cost allocation follows the principles below to match business needs:
- Costs are allocated to specific users. They are allocated to the entity that actually incurred costs not to the one that purchased the services.
- Costs are allocated based on the actual consumption. For example, if you purchased a yearly subscription at $365 USD in January, the cost can be recorded for January. But if you want to allocate the cost based on its actual consumption, then the cost can be amortized over the entire subscription term, with $1 USD recorded for each day within the year. Such cost allocation is referred to as cost amortization, which reflects a kind of cost accountability. For details, see Cost Amortization Rules.
- Shared costs should also be allocated within your organizations. An enterprise always has many shared costs incurred by common services, shared resources, platform services, and untagged resources. When shared costs are allocated, the increased visibility encourages the various business units to use shared resources more appropriately to reduce waste.
Visualized Cost Analysis
Huawei Cloud has a robust set of tools to visualize your cost data.
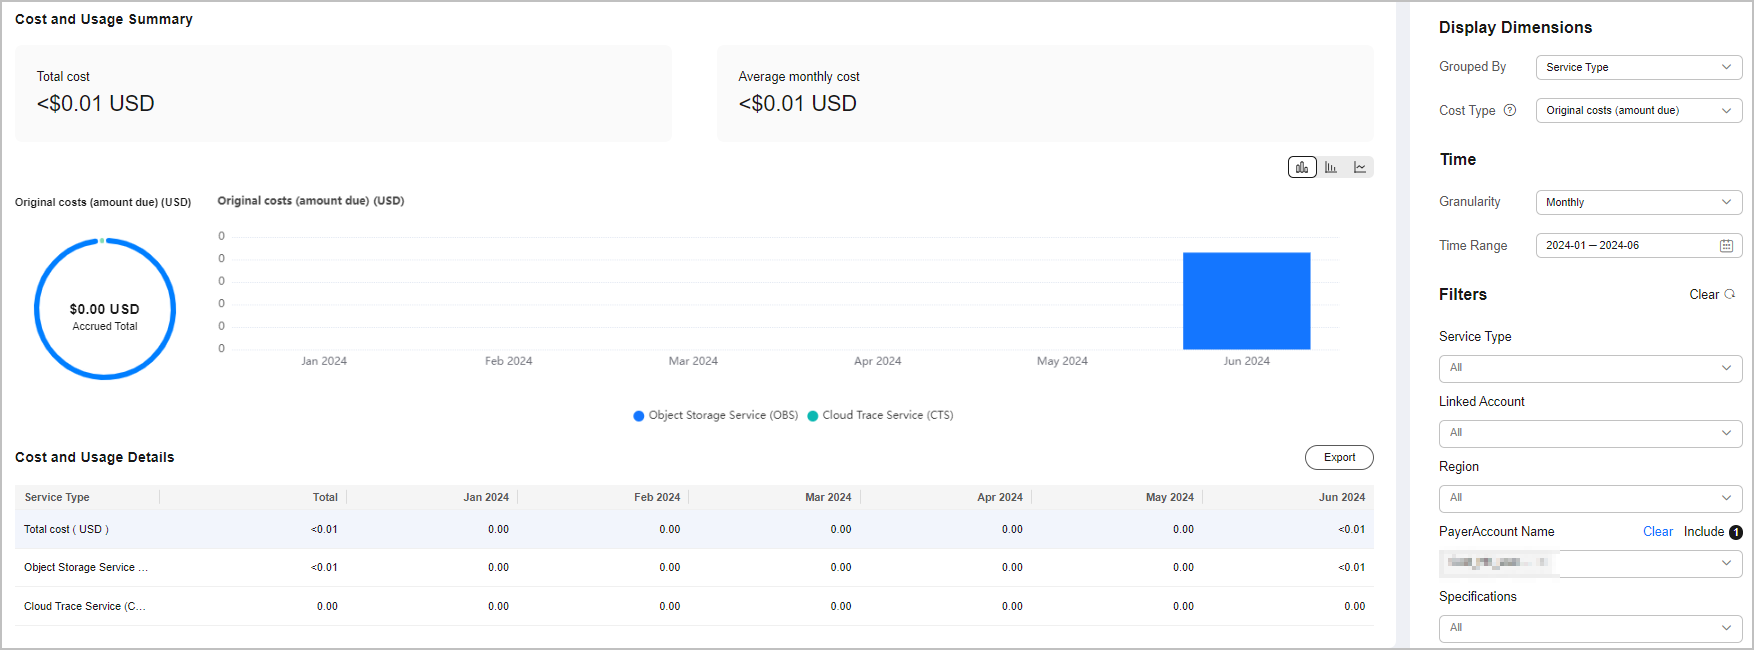
- On the Overview and Bills pages in the Billing Center, you can quickly learn the expenditures within the specified billing cycle. On the Cost Analysis page in Cost Center, you can analyze the cost and usage over a certain period by the day or month. You can get a quick view of how your costs are distributed. You can also select grouping dimensions and filters to further dig into and gain insight into costs. For details, see Viewing Cost Analyses. For example, you can group cost data by service type to learn which product is generating the most costs, and then filter the cost data by linked account, enterprise project, cost tag, or cost category to identify which entities have used the products generating the top costs.
Figure 1 Cost analysis

- If you want to integrate detailed cost data with data from your own cloud management platform to generate tailored cost and usage analysis, you can subscribe to bill details or call related APIs. For details, see Data Storage and API Reference. For example, you can combine the cost and usage details with the operations data of your enterprise to generate the KPIs for each business unit.
Figure 2 Subscribing to bill details

Multi-Dimensional Cost Allocation
Huawei Cloud helps you construct a cost allocation strategy that aligns with your organizational plan. Once cloud services incur costs within your organizational plan, you can use different grouping tools to gain visibility into your costs.
- You can use the grouping tools (linked account, enterprise project, or cost tag) listed in Table 1 to gain visibility into cost details and further analyze the cost distribution.
Table 1 Grouping tools for different cost types and allocation methods Cost Type
Allocation Method
Grouping Tool
Allocation Details
Original costs
Linked Account
Log in to Billing Center and choose Billing > Bills.
Log in to Cost Center and access the Cost Analysis page.
Log in to Billing Center and choose Billing > Bill Details.
Log in to Cost Center and access the Cost Details Export page to export the monthly original cost details.
Enterprise Project
Log in to Cost Center and access the Cost Analysis page.
Log in to Billing Center and choose Billing > Bill Details.
Log in to Cost Center and access the Cost Details Export page to export the monthly original cost details.
Cost Tag
Log in to Cost Center and access the Cost Analysis page.
Log in to Billing Center and choose Billing > Bill Details. The details contain unstructured data of the original tags.
Log in to Cost Center and access the Cost Details Export page to export the monthly original cost details with structured data of the cost tags included.
Amortized costs
Linked Account
Log in to Cost Center and access the Cost Analysis page.
Log in to Cost Center and access the Cost Details Export page to export the monthly amortized cost details.
Enterprise Project
Log in to Cost Center and access the Cost Analysis page.
Log in to Cost Center and access the Cost Details Export page to export the monthly amortized cost details.
Cost Tag
Log in to Cost Center and access the Cost Analysis page.
Log in to Cost Center and access the Cost Details Export page to export the monthly amortized cost details.
- You can also use cost categories to define rules with multiple conditions (service type, bill type, linked account, enterprise project, and cost tag) and allocate costs to meaningful categories based on your business needs. For details, see Viewing Costs By Cost Category. You can view these cost allocation results on the Cost Analysis page.
Shared Cost Splitting
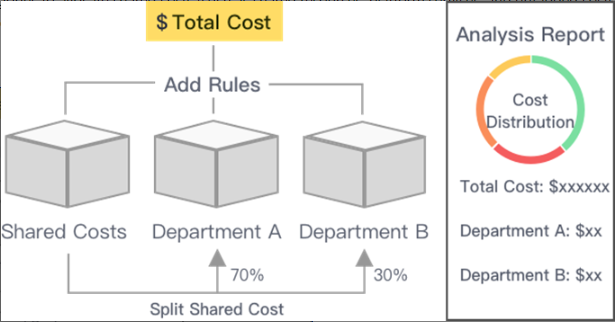
You can define cost categories to allocate shared costs (such as shared resources, platform services, and untagged costs) within your organization. These cost categories make it easier to reduce waste by fairly allocating costs for different teams or business departments, so they can be held accountable for their own expenditures. For details, see Example Cost Splitting Rules.

You can use the following to allocate costs:
- Proportionally: Your costs are allocated in proportion to weights assigned to each target.
- Evenly: Your costs are allocated evenly across different targets.
- Custom: Your costs are allocated based on a percentage you define for each target value.
You can view the results on the details page, as shown in the following figure.

Feedback
Was this page helpful?
Provide feedbackThank you very much for your feedback. We will continue working to improve the documentation.See the reply and handling status in My Cloud VOC.
For any further questions, feel free to contact us through the chatbot.
Chatbot


