Help Center/TaurusDB/User Guide/HTAP Analysis (Standard Edition)/Log Management/Viewing Error Logs of a Standard HTAP Instance
Updated on 2026-02-02 GMT+08:00
Viewing Error Logs of a Standard HTAP Instance
Scenarios
Error logs contain logs generated while a database is running. They can help you analyze problems with the database.
Viewing Log Details
- Log in to the TaurusDB console.
- Click
 in the upper left corner and select a region and project.
 - On the Instances page, locate a TaurusDB instance and click its name to access the Basic Information page.
- In the navigation pane, choose HTAP Analysis.
- Click the name of an HTAP instance to access the Basic Information page.
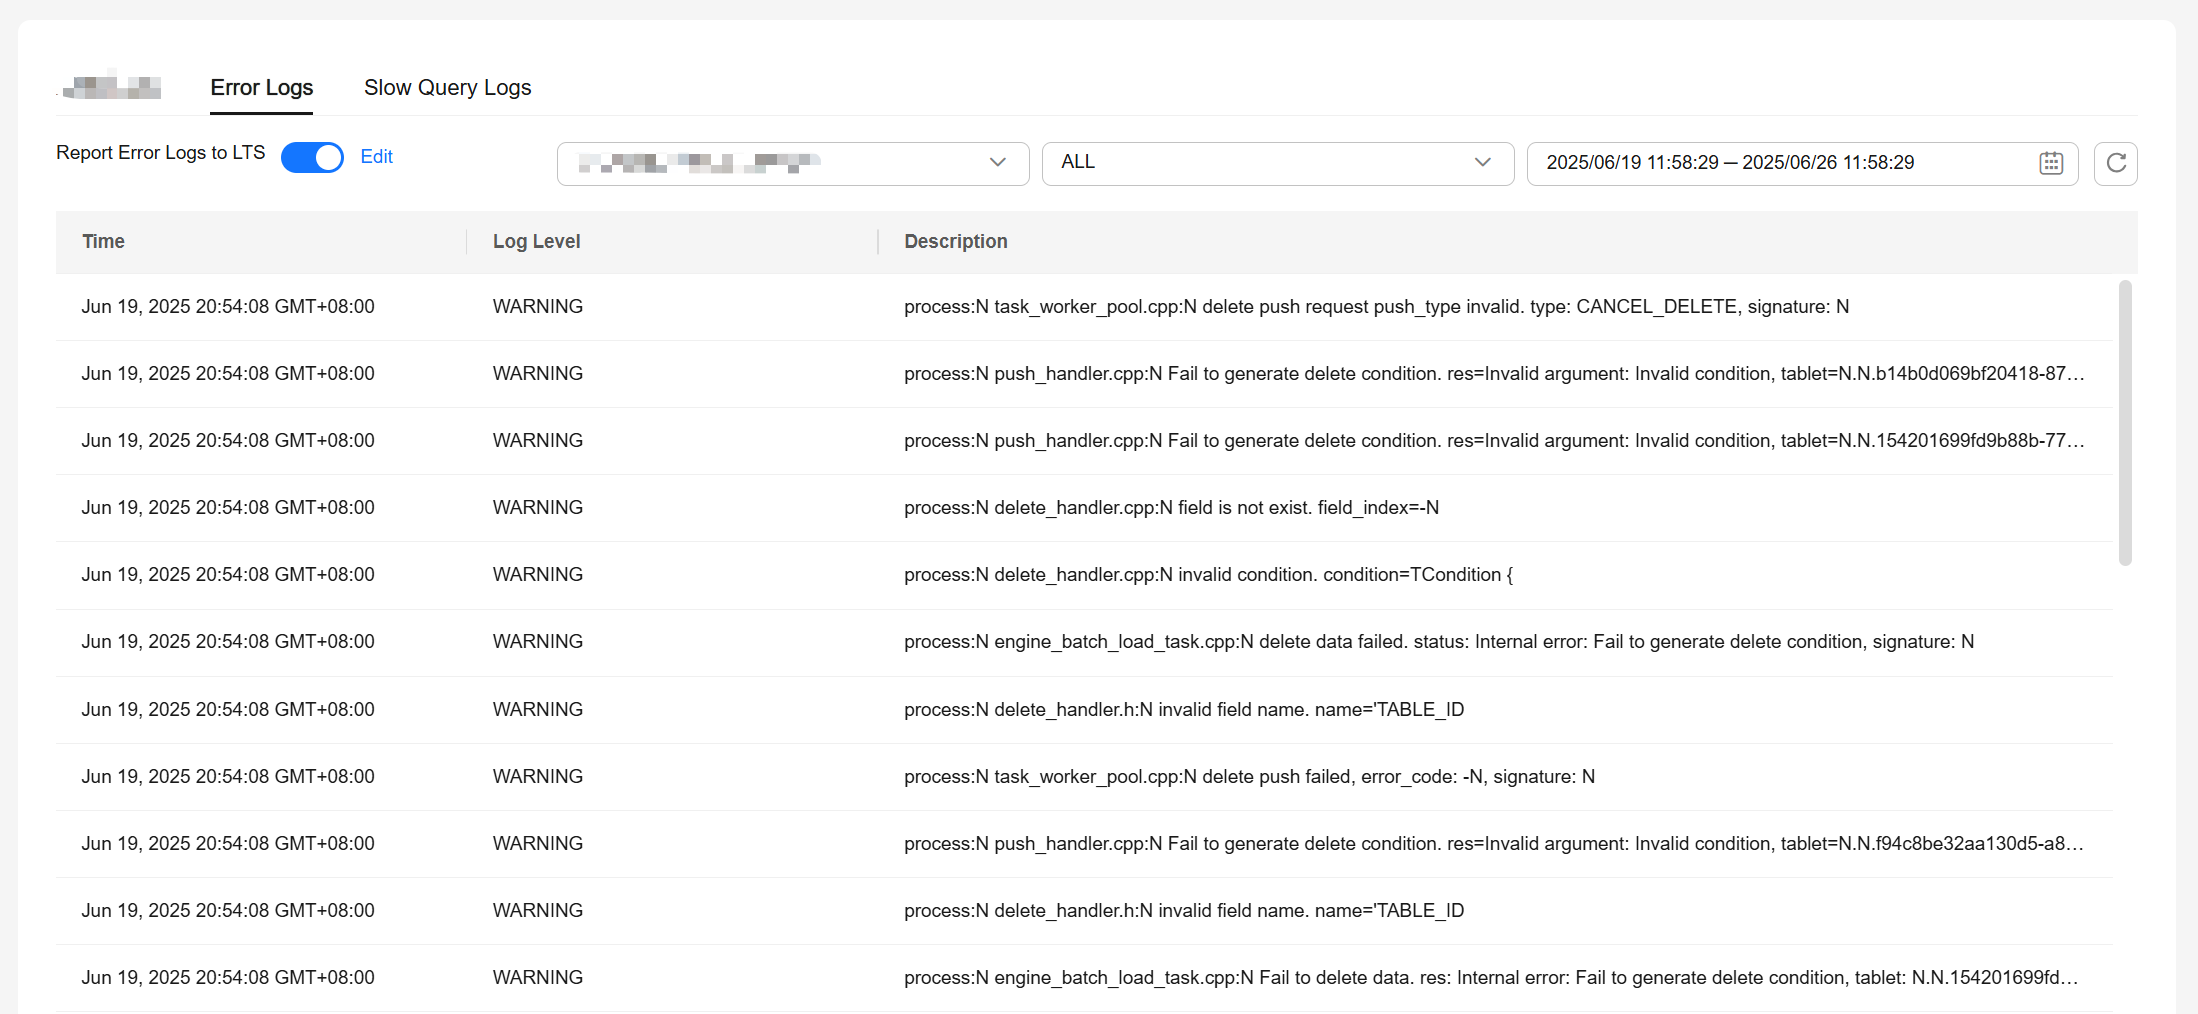
- Choose Logs and click the Error Logs tab to view error logs of different nodes, at different levels, and within a custom time range.
- Click the drop-down list in the upper right corner, and select a node name and a log level as needed.
Supported error log levels include ALL, INFO, WARNING, ERROR, FATAL, and NOTE.
Click
 and specify a time period.Figure 1 Viewing error logs
Reporting Error Logs to LTS
- Log in to the TaurusDB console.
- Click
 in the upper left corner and select a region and project.
 - On the Instances page, locate a TaurusDB instance and click its name to access the Basic Information page.
- In the navigation pane, choose HTAP Analysis.
- In the navigation pane, choose Logs.
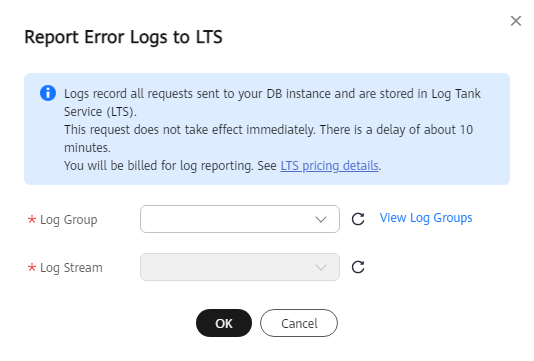
- On the Error Logs tab, click
 next to Report Error Logs to LTS.
 - In the displayed dialog box, specify Log Group and Log Stream and click OK.Figure 2 Reporting error logs to LTS

Feedback
Was this page helpful?
Provide feedbackThank you very much for your feedback. We will continue working to improve the documentation.See the reply and handling status in My Cloud VOC.
The system is busy. Please try again later.
For any further questions, feel free to contact us through the chatbot.
Chatbot


