Diagnosing Kafka Message Accumulation
Unprocessed messages accumulate if the client's consumption is slower than the server's sending. Accumulated messages cannot be consumed in time.
DMS for Kafka provides the message accumulation diagnosis function on the console. If there are accumulated messages, you can learn about the possible causes, affected partitions or brokers, and handling suggestions of the accumulation by viewing the diagnosis record.
Video Tutorial
Prerequisites
- A Kafka instance has been created, and a consumer group is consuming messages in non-assign mode.
- When a consumer group is being diagnosed, other consumer groups and other topics in the consumer group cannot be diagnosed.
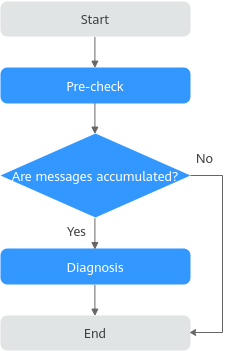
Process Flow

Step 1: Pre-check
- Log in to the Kafka console.
- Click
 in the upper left corner to select the region where your instance is located.
 - Click the desired instance to go to the instance details page.
- In the left navigation pane, choose Analysis & Diagnosis > Accumulation Diagnosis.
- Select the consumer groups and topics to be diagnosed, and click Pre-check.
If the check is successful, the message "Pre-checked" is displayed in the upper part of the page, and the check results of the memory usage, CPU usage, partition subscription relationships, accumulated messages, and traffic burst are displayed.
Figure 2 Pre-check
When the total number of stacked messages in all partitions of a topic is less than 2,000, Accumulated Messages displays no risk. In this case, message stack diagnosis is unavailable. If there are any risks in the Accumulated Messages area and the consumer group is not consuming message in the assign mode, you can perform message accumulation diagnosis.
Step 2: Diagnosis
- Click Start Diagnosis. In the Diagnosis Records area, a record in the Diagnosing state is displayed.
If the status changes to Successful, the diagnosis is complete.
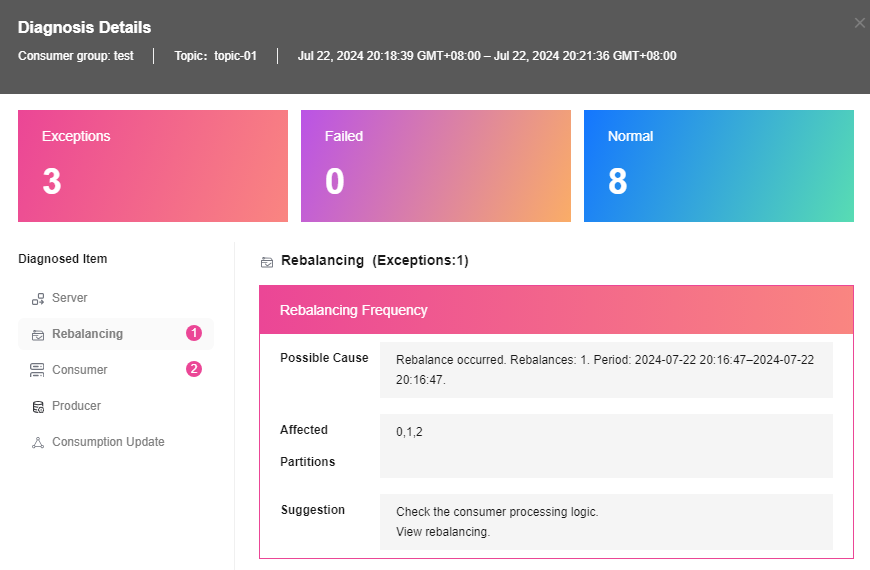
- Locate the row that contains the target diagnosis record, and click View Details. The Diagnosis Details page is displayed.
- View the number of abnormal, failed, and normal items in the upper part of the page. In the Diagnosed Item area, click an abnormal item, such as Rebalancing, and view the possible causes, affected partitions or brokers, and handling suggestions.
Figure 3 Diagnosis details

Related Document
To view a diagnosis report by calling an API, see Querying Diagnosis Report Details.
Feedback
Was this page helpful?
Provide feedbackThank you very much for your feedback. We will continue working to improve the documentation.See the reply and handling status in My Cloud VOC.
For any further questions, feel free to contact us through the chatbot.
Chatbot


