Viewing the System Monitoring
You can easily troubleshoot issues by viewing the device status and monitoring the system's resource usage.
Procedure
- Log in to a database encryption and access control instance as the sysadmin user.
- In the navigation pane on the left, choose System Management > System O&M.
- Click the System Monitoring tab.
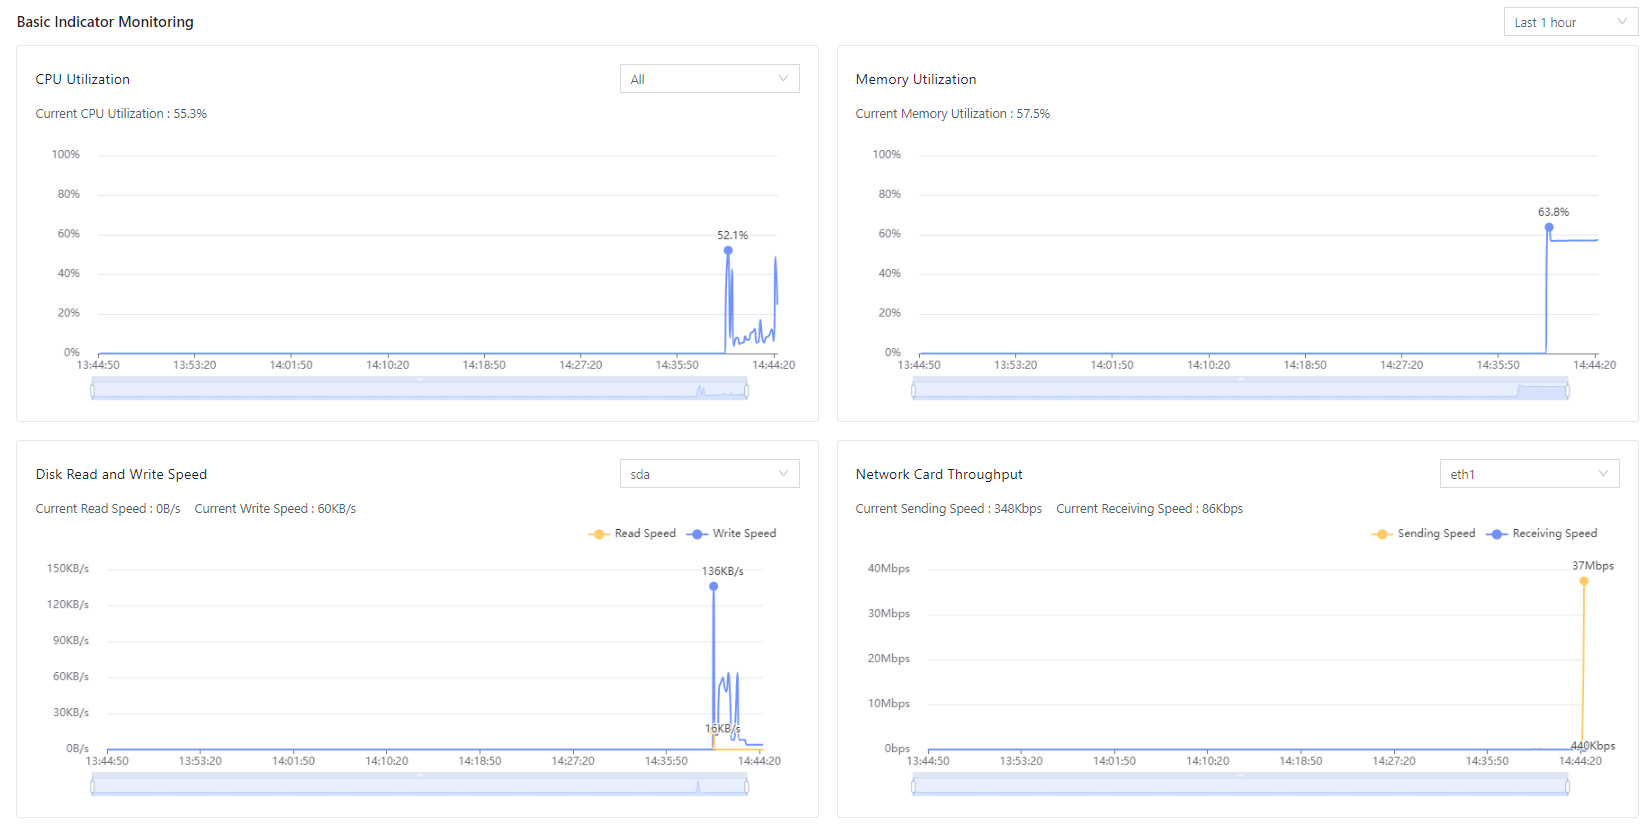
- On the displayed page, view real-time and historical information about your system's performance, including CPU utilization, memory utilization, disk read and write speed, and NIC throughput. You can also see current disk partitions and the status of critical services.
Figure 1 Basic device indicator monitoring

Table 1 Parameter descriptions Parameter
Description
Hardware
Displays system hardware details, including CPU, memory, and disk specifications and usage.
CPU Utilization
Displays CPU usage over the past hour, current day, or a custom time period selected by the user.
Memory Utilization
Displays memory usage over the past hour, current day, or a custom time period selected by the user.
Disk Read and Write Speed
Displays displays changes in disk read/write speeds over the last hour, current day, or a custom time period selected by the user.
NIC Throughput
Displays network interface card (NIC) throughput for the past hour, current day, or a custom time period selected by the user.
Disk Partition Usage
Displays the status and usage of each partition.
Critical Service Monitoring
Displays the running status and resource usage of critical services.
- (Optional) You can restart the service and restart or disable the device in the upper right corner.

These operations will affect the running of asset management services. Perform the operations during off-peak hours.
Feedback
Was this page helpful?
Provide feedbackThank you very much for your feedback. We will continue working to improve the documentation.See the reply and handling status in My Cloud VOC.
For any further questions, feel free to contact us through the chatbot.
Chatbot


