Viewing Metrics on the AOM Console
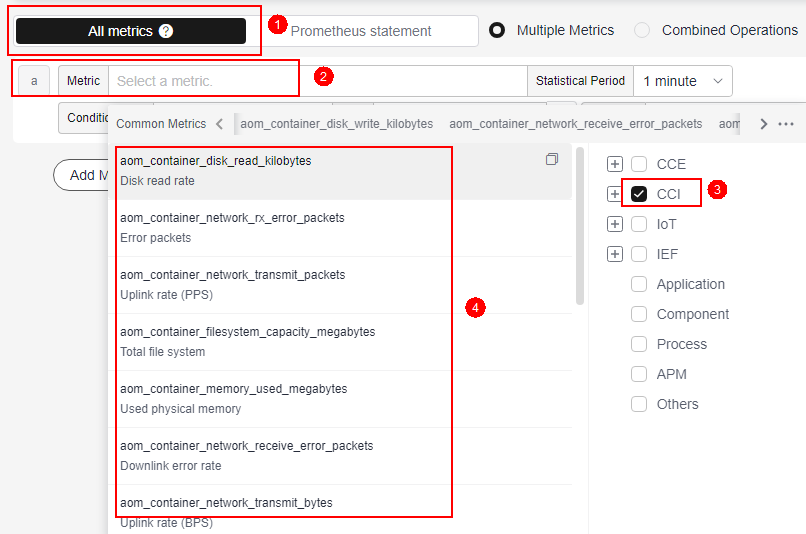
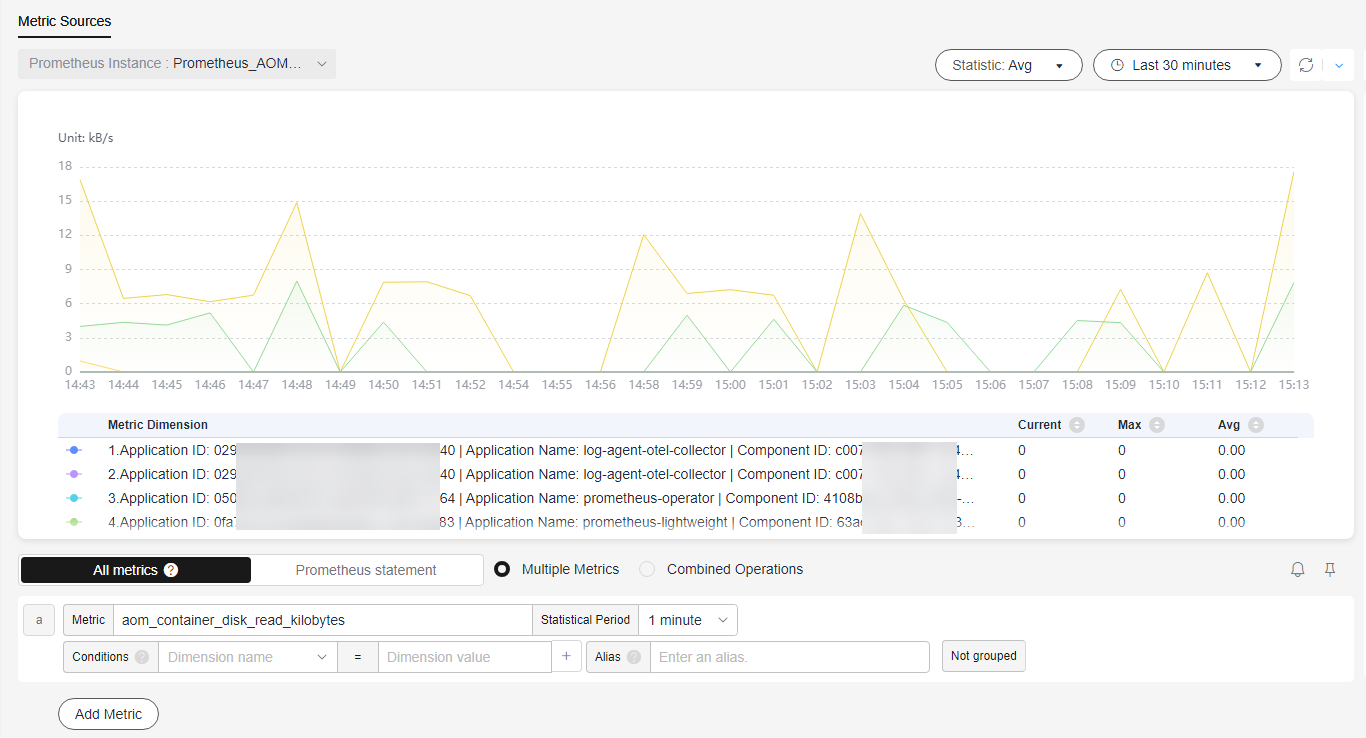
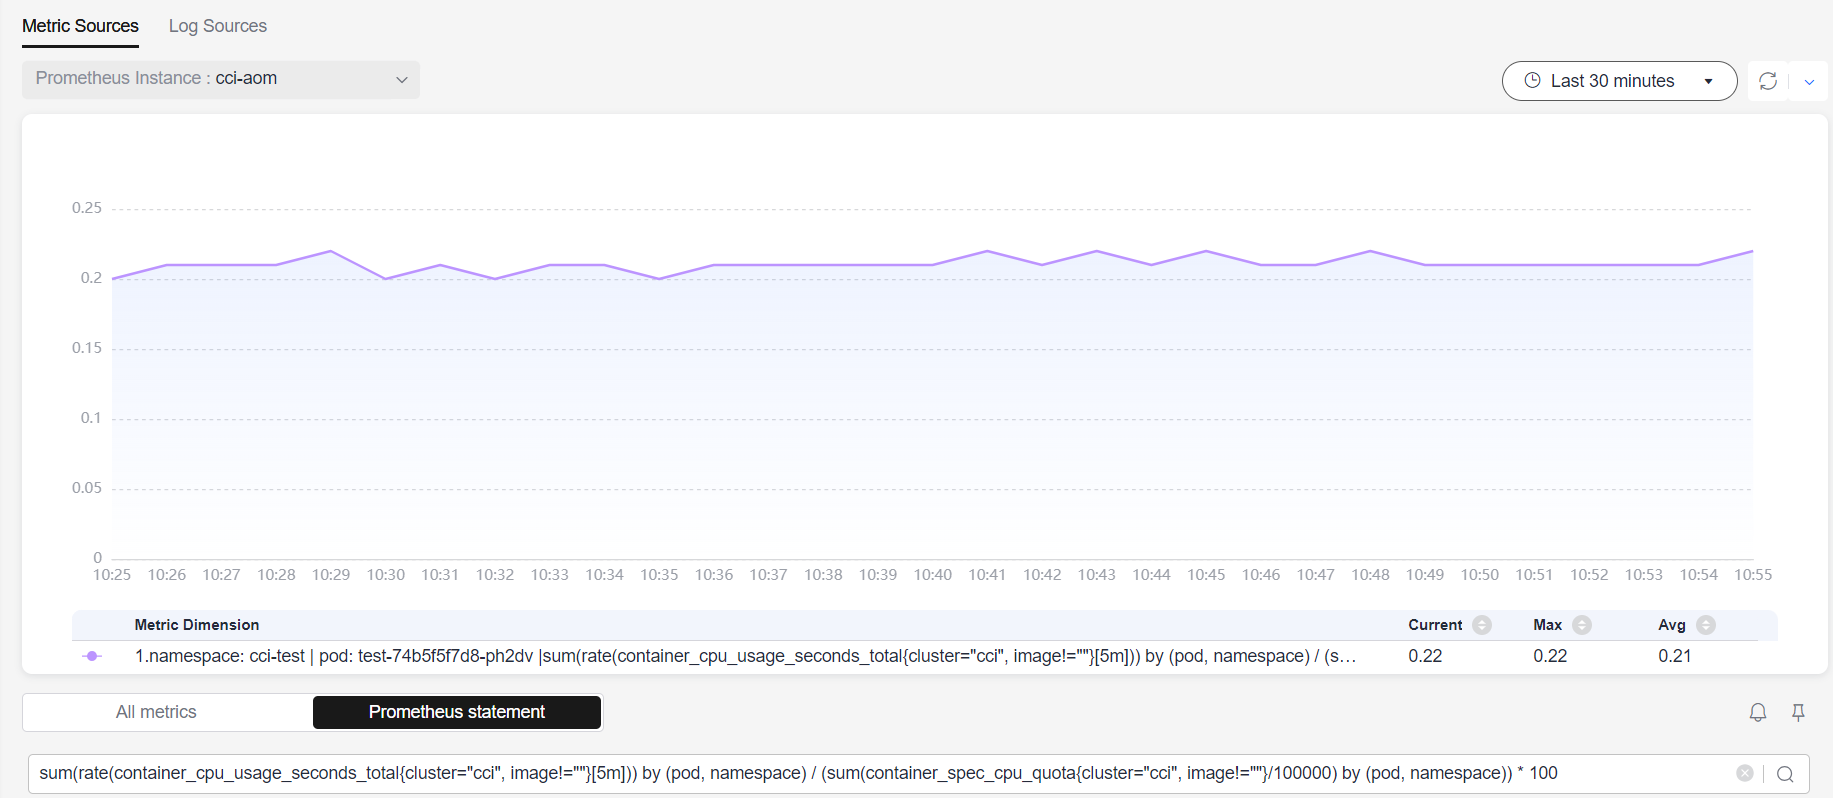
A Prometheus instance for cloud services can be used to monitor multiple metrics of CCI 2.0. For more metrics, go to the AOM console to query all metrics or use PromQL statements to query all CCI 2.0 metrics.
Constraints
Only one Prometheus instance for cloud services can be created in an enterprise project.
CCI 2.0 supports monitoring only in the TR-Istanbul, AF-Johannesburg, AP-Singapore, and ME-Riyadh regions.
Step 1: Create a Prometheus Instance
- Log in to the AOM console.
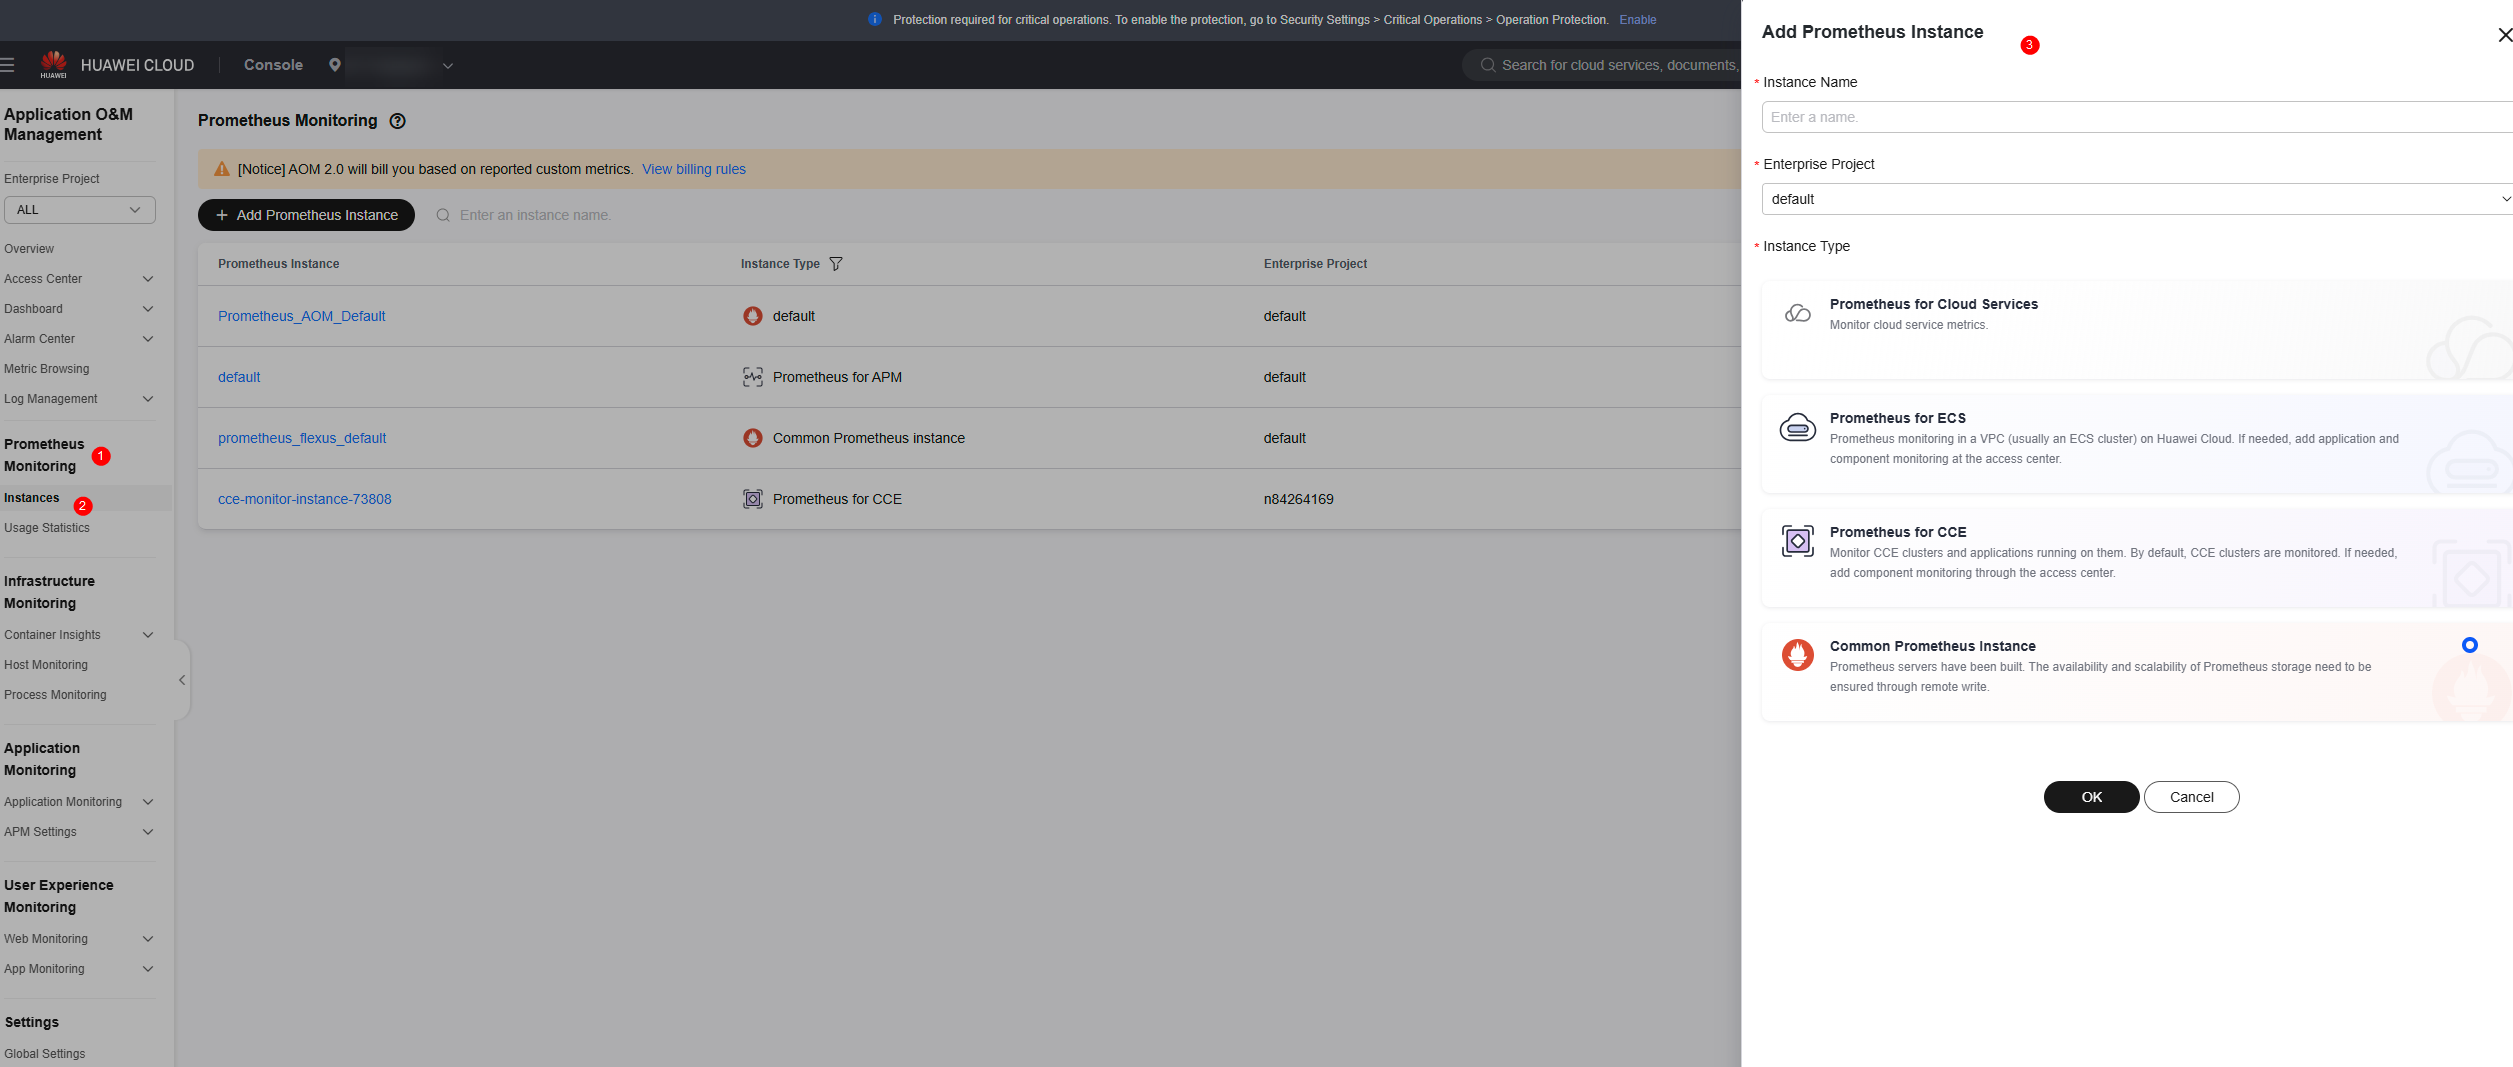
- In the navigation pane, choose Prometheus Monitoring > Instances. On the displayed page, click Add Prometheus Instance.
- Set the instance name, enterprise project, and instance type.

If the CCE Cloud Bursting Engine for CCI add-on is being used or required, the CCE cluster also needs this Prometheus instance, with the instance type set to Prometheus for CCE.

- Click OK.
Step 2: Connect Metrics Using the CCI 2.0 Console
- Log in to the CCI 2.0 console.
- Select the target namespace, click Edit in the Operation column, and then enable AOM (Optional).
- Select the AOM instance. For details about how to create an AOM instance, see Step 1: Create a Prometheus Instance.
- Click OK.
Feedback
Was this page helpful?
Provide feedbackThank you very much for your feedback. We will continue working to improve the documentation.See the reply and handling status in My Cloud VOC.
For any further questions, feel free to contact us through the chatbot.
Chatbot


