
Using Cloud Eye to Monitor ELB Resources
Scenarios
Cloud Eye is a multi-dimensional resource monitoring service. You can use Cloud Eye to monitor ELB resources in real time, set alarm rules, identify resource exceptions, and quickly respond to resource changes.
You can set alarm rules on the Cloud Eye console to send you notifications in case of exceptions.
This section describes how you can use monitoring metrics to monitor ELB resources in basic service scenarios. You can adjust the monitoring thresholds as required, but keep them below the recommended values.
Procedure
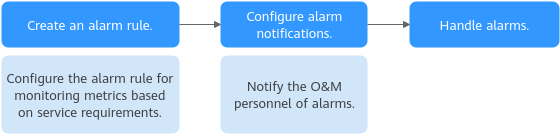
Creating an Alarm Rule and Configuring Alarm Notifications
After an alarm rule is created, if a metric reaches the specified threshold or there is an event, Cloud Eye immediately informs you of the exception through SMN. The following describes how you can create an alarm rule and set notification rules.
- Log in to the Cloud Eye console.
- In the navigation pane on the left, choose Alarm Management > Alarm Rules.
- Click Create Alarm Rule in the upper right corner.
- On the Create Alarm Rule page, configure parameters as needed.
- Configure the basic information for the alarm rule.
Table 1 Parameters for configuring the basic information of the alarm rule Parameter
Description
Example Value
Name
Name of the alarm rule. The system generates a name randomly, and you can change it as you want.
alarm-elb
Description
(Optional) Supplementary information about the alarm rule.
-
- Select an object to be monitored and set alarm parameters.
Table 2 Alarm parameters Parameter
Description
Example Value
Alarm Type
The alarm type that the alarm rule applies to.
Metric
Cloud Product
The cloud product you want to monitor. This parameter is only available if you select Metric for Alarm Type.
For details about the metrics supported by ELB, see ELB Monitoring Metrics.
Elastic Load Balance - Elastic Load Balancers
Resource Level
The resource level of the alarm rule. This parameter is only available if you select Metric for Alarm Type. You can select Cloud product (recommended) or Specific dimension.
For ELB, the dimension can be Elastic Load Balancers, Elastic Load Balancers - Listeners, Elastic Load Balancers - Backend Server Groups, or Elastic Load Balancers - Availability Zones.
Cloud product
Monitoring Scope
The resource scope that the alarm rule will apply to. This parameter is only available if you select Metric for Alarm Type. You can select All resources, Resource groups, or Specific resources.
NOTE:- All resources: An alarm will be triggered if any resource of the current cloud product meets the alarm policy. To exclude resources that do not need to be monitored, click Select Resources to Exclude.
- Resource groups: An alarm will be triggered if any resource in the resource group meets the alarm policy. To exclude resources that do not need to be monitored, click Select Resources to Exclude.
- Specific resources: Click Select Specific Resources to select resources.
All resources
Method
- Configure manually: Specify the metric name and alarm policy. An alarm will be triggered when any policy is met.
- Associate template: If the associated template is modified, the alarm policies in this alarm rule will be modified as well.
Configure manually
Alarm Policy
If a metric exceeds its threshold repeatedly within a specified period, you will be notified.
For details about how to configure monitoring metrics, see Recommended Monitoring Metrics for Basic Service Scenarios (Dedicated Load Balancers) or Recommended Monitoring Metrics for Basic Service Scenarios (Shared Load Balancers).
NOTE:A maximum of 50 alarm policies can be added to an alarm rule. If any of these alarm policies is met, an alarm will be triggered.
-
Alarm Severity
Alarm severity, which can be Critical, Major, Minor, or Warning.
-
- Configure parameters for alarm notifications.
Figure 2 Configuring an alarm notification
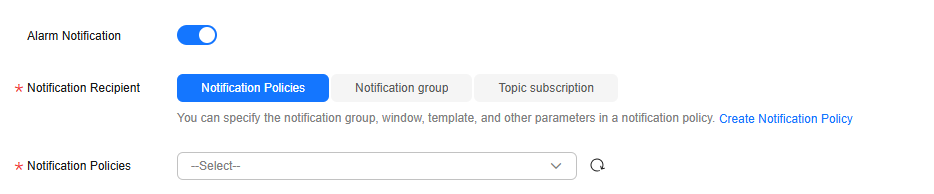
Table 3 Parameters for configuring an alarm notification Parameter
Description
Alarm Notifications
Whether to send notifications to users via SMS, email, voice notification, HTTP, HTTPS, FunctionGraph (function), FunctionGraph (workflow), WeCom chatbot, DingTalk chatbot, Lark chatbot, or WeLink chatbot.
Notified By
The following options are available:
- Notification groups: Configure notification templates on Cloud Eye.
- Topic subscriptions: Configure notification templates on SMN.
Notification Policies
This parameter is only available if you select Notification policies for Notified By. Select one or more notification policies. You can specify the notification group, window, template, and other parameters in a notification policy.
Notification Group
This parameter is only available if you select Notification groups for Notified By. Select the notification groups to which alarm notifications will be sent.
Recipient
This parameter is only available if you select Topic subscriptions for Notified By. You can select the account contact or a topic name as the object to which alarm notifications will be sent.
- Account contact is the mobile number and email address of the registered account.
- Topic is used to publish messages and subscribe to notifications. If the required topic is unavailable, create one first and add subscriptions to it. For details, see Creating a Topic and Adding Subscriptions.
Notification Template
This parameter is only available if you select Notification groups or Topic subscriptions for Notified By. You can select an existing template or create a new one.
Notification Window
This parameter is only available if you select Notification groups or Topic subscriptions for Notified By.
Cloud Eye sends notifications only within the notification window you specified.
If Notification Window is set to 08:00-20:00, Cloud Eye sends notifications only within this window.
Trigger Condition
This parameter is only available if you select Notification groups or Topic subscriptions for Notified By.
You can select either Generated alarm or Cleared alarm, or both.
- Configure Enterprise Project and Tags.
Table 4 Parameter descriptions Parameter
Description
Enterprise Project
Enterprise project to which the alarm rule belongs. Only users with the enterprise project permissions can manage the alarm rule.
Tags
Key-value pairs that you can use to easily categorize and search for cloud resources.
- A key can contain up to 128 characters, and a value can contain up to 225 characters.
- You can add up to 20 tags.
- Click Create.
- Configure the basic information for the alarm rule.
After the alarm rule is created, if a metric reaches the specified threshold or there is an event, Cloud Eye immediately informs you of the exception through SMN.
Recommended Monitoring Metrics for Basic Service Scenarios (Dedicated Load Balancers)
You can use the following metrics to monitor the performance, Layer 7 service operations, and the health status of backend servers of dedicated load balancers.
For details about the metrics supported by dedicated load balancers, see ELB Monitoring Metrics.
You can use the metrics in the below table to quickly identify whether the service traffic exceeds the threshold.
You can modify the load balancer specifications and add additional AZs to handle the alarms.
|
Metric |
Alarm Policy |
||||||
|---|---|---|---|---|---|---|---|
|
ID |
Metric Name |
Monitored Object |
Statistic |
Consecutive Triggering Times |
Operator |
Threshold |
Frequency |
|
l4_ncps_usage |
Layer 4 New Connection Usage |
|
Raw data |
3 |
> |
Critical: 80% |
Every 1 hour |
|
l4_con_usage |
Layer 4 Concurrent Connection Usage |
|
Raw data |
3 |
> |
Critical: 80% |
Every 1 hour |
|
l4_in_bps_usage |
Layer 4 Inbound Bandwidth Usage |
|
Raw data |
3 |
> |
Major: 80% |
Every 1 hour |
|
l4_out_bps_usage |
Layer 4 Outbound Bandwidth Usage |
|
Raw data |
3 |
> |
Major: 80% |
Every 1 hour |
|
l7_ncps_usage |
Layer 7 New Connection Usage |
|
Raw data |
3 |
> |
Critical: 80% |
Every 1 hour |
|
l7_con_usage |
Layer 7 Concurrent Connection Usage |
|
Raw data |
3 |
> |
Critical: 80% |
Every 1 hour |
|
l7_qps_usage |
Layer 7 QPS Usage |
|
Raw data |
3 |
> |
Critical: 80% |
Every 1 hour |
|
l7_in_bps_usage |
Layer 7 Inbound Bandwidth Usage |
|
Raw data |
3 |
> |
Major: 80% |
Every 1 hour |
|
l7_out_bps_usage |
Layer 7 Outbound Bandwidth Usage |
|
Raw data |
3 |
> |
Major: 80% |
Every 1 hour |
|
dropped_connections |
Dropped Connections |
Load balancer |
Raw data |
1 |
> |
Critical: 0 |
Every 1 hour |
|
dropped_packets |
Dropped Packets |
Load balancer |
Raw data |
1 |
> |
Critical: 0 |
Every 1 hour |
|
dropped_traffic |
Bandwidth for Dropping Packets |
Load balancer |
Raw data |
1 |
> |
Critical: 0 |
Every 1 hour |
You can use the Layer 7 status codes to quickly identify whether service requests are correctly processed.
You can view the access logs to check service status and handle alarms.
|
Metric |
Alarm Policy |
||||||
|---|---|---|---|---|---|---|---|
|
ID |
Metric Name |
Monitored Object |
Statistic |
Consecutive Triggering Times |
Operator |
Threshold |
Frequency |
|
mb_l7_qps |
Layer 7 Query Rate |
Listener |
Raw data |
1 |
Increase or decrease compared with last period |
Major: 20% |
Every 1 hour |
|
mc_l7_http_2xx |
2xx Status Codes (Total) |
Listener |
Raw data |
1 |
Increase or decrease compared with last period |
Major: 20% |
Every 1 hour |
|
me_l7_http_4xx |
4xx Status Codes (Total) |
Listener |
Raw data |
1 |
Increase or decrease compared with last period |
Major: 20% |
Every 1 hour |
|
mf_l7_http_5xx |
5xx Status Codes (Total) |
Listener |
Raw data |
1 |
Increase or decrease compared with last period |
Major: 20% |
Every 1 hour |
|
m14_l7_rt |
Average Layer 7 Response Time |
Listener |
Raw data |
1 |
Increase or decrease compared with last period |
Major: 20% |
Every 1 hour |
|
m15_l7_upstream_4xx |
4xx Status Codes (Backend Servers) |
Listener |
Raw data |
1 |
Increase or decrease compared with last period |
Major: 20% |
Every 1 hour |
|
m16_l7_upstream_5xx |
5xx Status Codes (Backend Servers) |
Listener |
Raw data |
1 |
Increase or decrease compared with last period |
Major: 20% |
Every 1 hour |
You can view the Unhealthy Servers metric to learn about the health status of backend servers in a timely manner.
You can troubleshoot an unhealthy backend server and handle the alarms.
|
Metric |
Alarm Policy |
||||||
|---|---|---|---|---|---|---|---|
|
ID |
Metric Name |
Monitored Object |
Statistic |
Consecutive Triggering Times |
Operator |
Threshold |
Frequency |
|
m9_abnormal_servers |
Unhealthy Servers |
|
Raw data |
1 |
> |
Critical: 0 |
Every 1 hour |
Recommended Monitoring Metrics for Basic Service Scenarios (Shared Load Balancers)
You can use the following metrics to monitor the performance, Layer 7 service operations, and the health status of backend servers of shared load balancers.
For details about the metrics supported by shared load balancers, see ELB Monitoring Metrics.
You can use the metrics in the below table to quickly identify whether the service traffic exceeds the threshold.
|
Metric |
Alarm Policy |
||||||
|---|---|---|---|---|---|---|---|
|
ID |
Metric Name |
Monitored Object |
Statistic |
Consecutive Triggering Times |
Operator |
Threshold |
Frequency |
|
m1_cps |
Concurrent Connections |
Load balancer |
Raw data |
3 |
> |
Critical: 40000 |
Every 1 hour |
|
m4_ncps |
New Connections |
Load balancer |
Raw data |
3 |
> |
Critical: 4000 |
Every 1 hour |
You can use the Layer 7 status codes to quickly identify whether service requests are correctly processed.
You can view the access logs to check service status and handle alarms.
|
Metric |
Alarm Policy |
||||||
|---|---|---|---|---|---|---|---|
|
ID |
Metric Name |
Monitored Object |
Statistic |
Consecutive Triggering Times |
Operator |
Threshold |
Frequency |
|
mb_l7_qps |
Layer 7 Query Rate |
Listener |
Raw data |
1 |
Increase or decrease compared with last period |
Major: 20% |
Every 1 hour |
|
m14_l7_rt |
Average Layer 7 Response Time |
Listener |
Raw data |
1 |
Increase or decrease compared with last period |
Major: 20% |
Every 1 hour |
|
mc_l7_http_2xx |
2xx Status Codes (Total) |
Listener |
Raw data |
1 |
Increase or decrease compared with last period |
Major: 20% |
Every 1 hour |
|
me_l7_http_4xx |
4xx Status Codes (Total) |
Listener |
Raw data |
1 |
Increase or decrease compared with last period |
Major: 20% |
Every 1 hour |
|
mf_l7_http_5xx |
5xx Status Codes (Total) |
Listener |
Raw data |
1 |
Increase or decrease compared with last period |
Major: 20% |
Every 1 hour |
|
m15_l7_upstream_4xx |
4xx Status Codes (Backend Servers) |
Listener |
Raw data |
1 |
Increase or decrease compared with last period |
Major: 20% |
Every 1 hour |
|
m16_l7_upstream_5xx |
5xx Status Codes (Backend Servers) |
Listener |
Raw data |
1 |
Increase or decrease compared with last period |
Major: 20% |
Every 1 hour |
You can view the Unhealthy Servers metric to learn about the health status of backend servers in a timely manner.
You can troubleshoot an unhealthy backend server and handle the alarms.
|
Metric |
Alarm Policy |
||||||
|---|---|---|---|---|---|---|---|
|
ID |
Metric Name |
Monitored Object |
Statistic |
Consecutive Triggering Times |
Operator |
Threshold |
Frequency |
|
m9_abnormal_servers |
Unhealthy Servers |
Load balancer |
Raw data |
1 |
> |
Critical: 0 |
Every 1 hour |
Feedback
Was this page helpful?
Provide feedbackThank you very much for your feedback. We will continue working to improve the documentation.See the reply and handling status in My Cloud VOC.
For any further questions, feel free to contact us through the chatbot.
Chatbot


