Developing and Testing a Microservice Locally Using Telepresence
Kubernetes applications are typically composed of multiple separate services, each running in its own container. This can complicate development and debugging on a remote Kubernetes cluster, as you may need to access a shell on a running container to execute debugging tools.
In a typical Kubernetes development workflow, developers must repeat the following steps:
- Modify the code.
- Build a new image.
- Push the image to the repository.
- Update the Deployment.
- Wait for pods to restart.
- Verify the changes.
This process can take several minutes or even longer, which greatly slows down iteration.
Telepresence is a tool that injects Traffic Agents as sidecar containers into workload pods. These Traffic Agents function as proxies, rerouting network traffic between a CCE cluster and your local environment. This setup enables you to develop and test your applications locally using tools such as your preferred debugger and integrated development environment (IDE), as if your local environment were part of the CCE cluster.
This section describes how to develop and debug services running on a CCE cluster using Telepresence. For details, see Code and debug an application locally.
Prerequisites
You have created a CCE cluster and accessed the cluster using kubectl in your local environment. For details, see Accessing a Cluster Using kubectl.
Installing Telepresence
- Install the Telepresence client in your local environment.
- Download the Telepresence binary file. The installation procedure varies by OS. AMD64 is used as an example. For details about more installation methods, see Client Installation.
sudo curl -fL https://github.com/telepresenceio/telepresence/releases/latest/download/telepresence-linux-amd64 -o /usr/local/bin/telepresence
- Add execute permissions to the file.
sudo chmod a+x /usr/local/bin/telepresence
- Download the Telepresence binary file. The installation procedure varies by OS. AMD64 is used as an example. For details about more installation methods, see Client Installation.
- Install Telepresence Traffic Manager in the CCE cluster. For details, see Install/Uninstall the Traffic Manager.
Run the following command in your local environment where the Telepresence client was installed:
telepresence helm install
Configuring an Interception Rule
- Access kube-apiserver of the CCE cluster in your local development environment.
telepresence connect
- Create a Deployment as an example, which is deployed using an Nginx image.
kubectl create deployment echo-server --image=nginx --port=80 --replicas=1
Information similar to the following is displayed:
deployment.apps/echo-server
- Create a Service and associate it with the Deployment.
The following is an example YAML file:
apiVersion: v1
kind: Service
metadata:
  labels:
    app: echo-server
  name: echo-server
  namespace: default
spec:
  internalTrafficPolicy: Cluster
  ipFamilies:
  - IPv4
  ipFamilyPolicy: SingleStack
  ports:
  - name: http
    port: 80
    protocol: TCP
    targetPort: 80
  selector:
    app: echo-server
  sessionAffinity: None
  type: ClusterIP
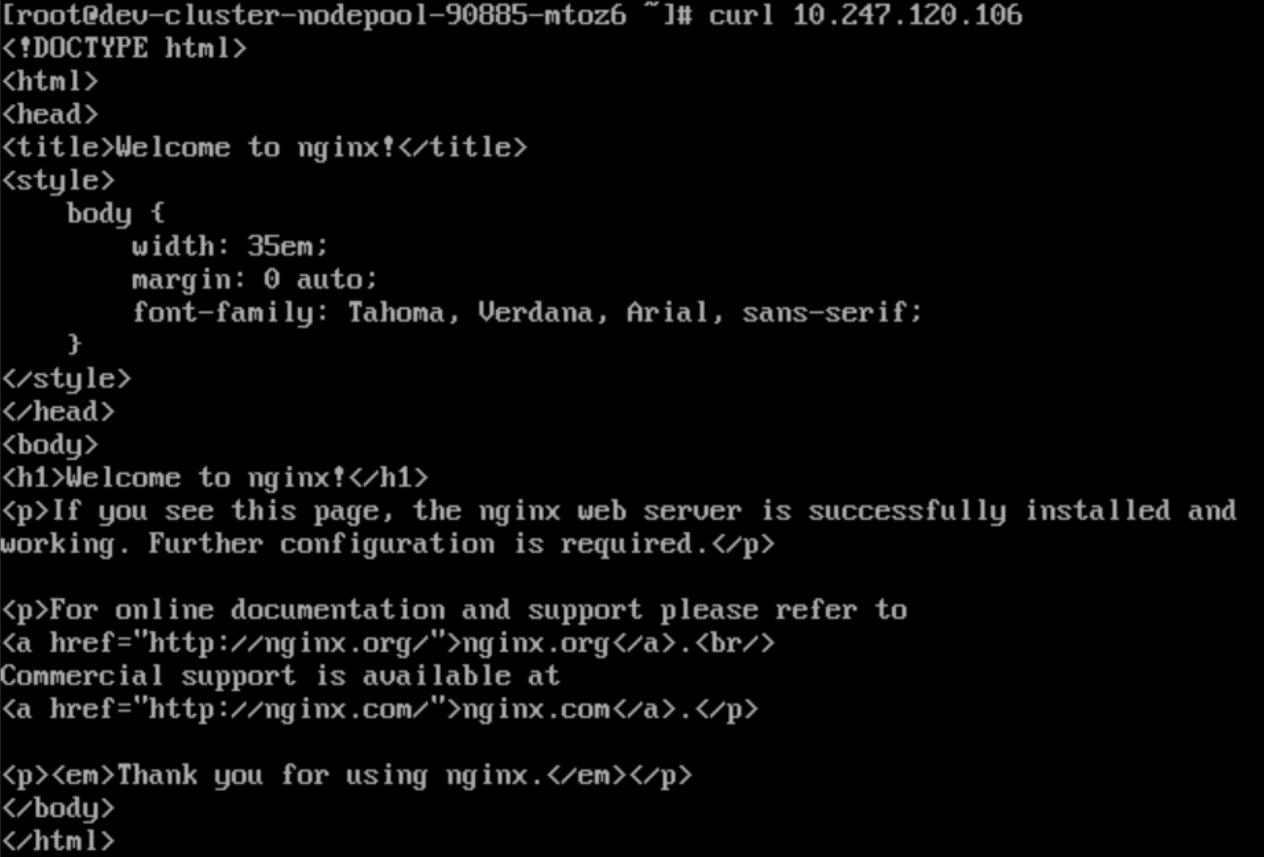
In the cluster, use cURL to test the connectivity of the ClusterIP Service. If the access is successful, information similar to the following will be displayed.

- Specify the traffic to be intercepted. The following command shows an example. This command establishes a rule to redirect traffic sent to the echo-server Service to localhost:80. By doing so, you can debug the functionality of the echo-server Service in your local environment by listening on localhost:80.
telepresence intercept echo-server --port 80:80
Information similar to the following is displayed:
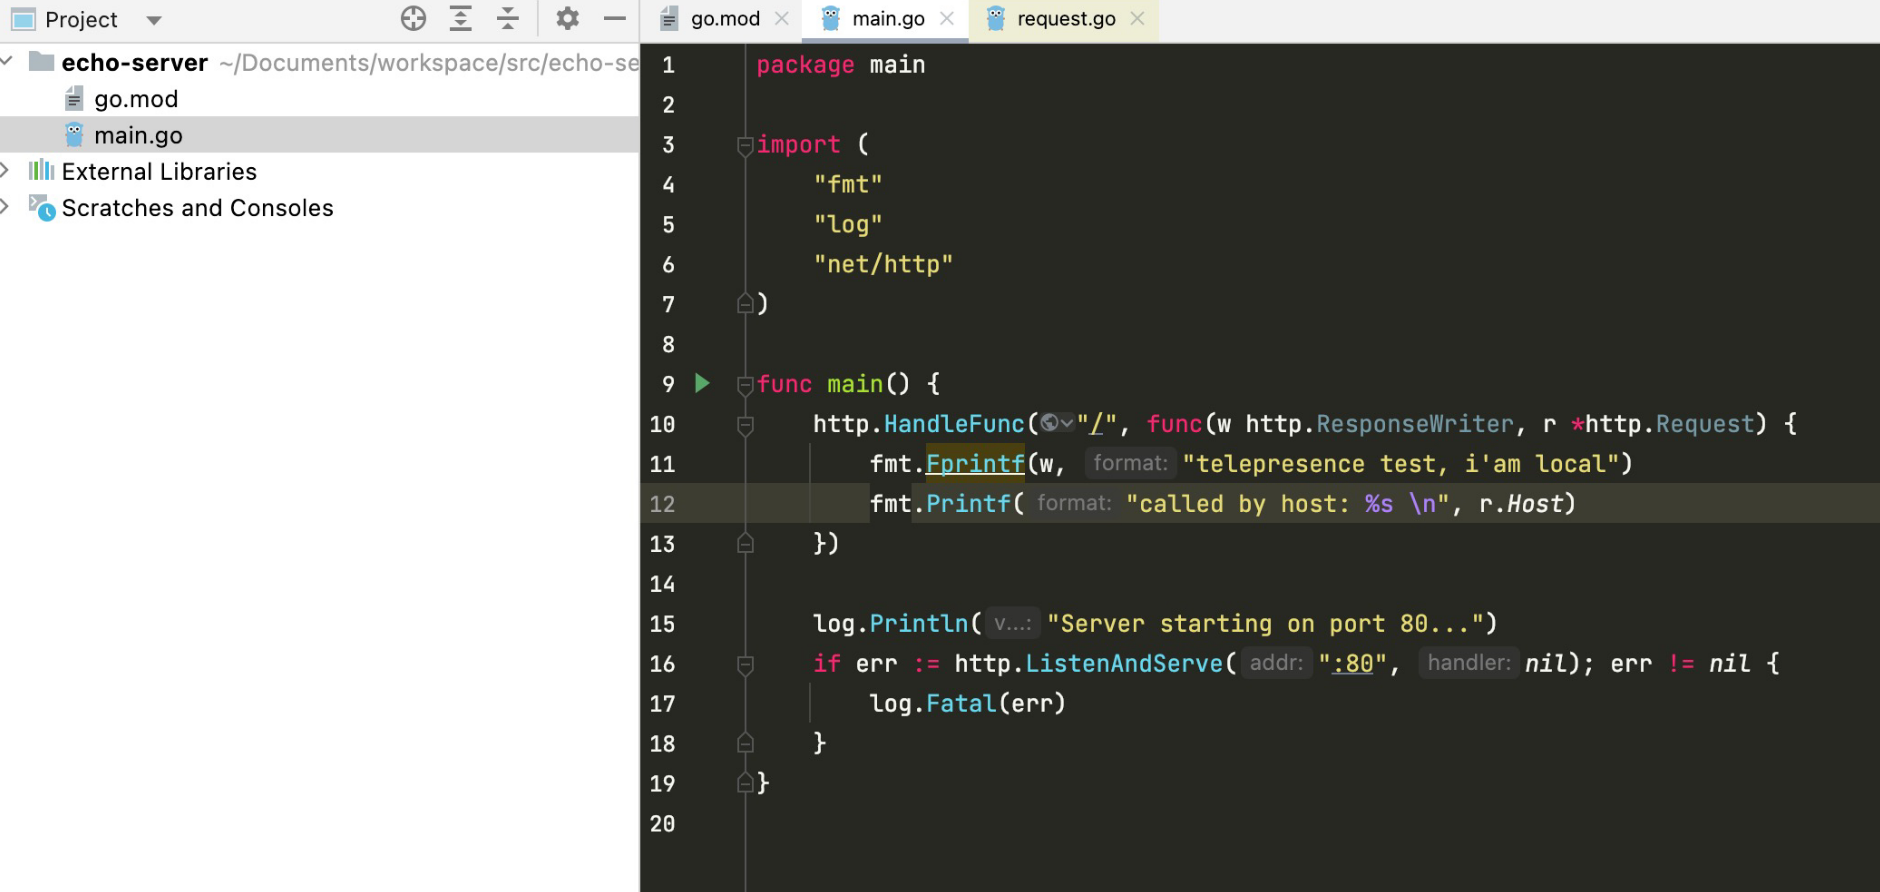
Using Deployment echo-server Intercept name : echo-server State : ACTIVE Workload kind : Deployment Intercepting : 192.168.1.215 -> 127.0.0.1 80 -> 80 TCP - Write an HTTP server in the local IDE to listen on port 80.

- Access the echo-server Service in the cluster again. If information similar to the following is displayed, the traffic has been sent to the local server.

The logs printed by the local server indicate that the requests forwarded from the cluster have been received.

Feedback
Was this page helpful?
Provide feedbackThank you very much for your feedback. We will continue working to improve the documentation.See the reply and handling status in My Cloud VOC.
For any further questions, feel free to contact us through the chatbot.
Chatbot


