Viewing Alert Details
Scenario
On the Alerts page in SecMaster, you can check the alert list for the last 360 days. The list contains alert names, types, severity levels, and occurrence time. By customizing filtering conditions, such as the alert name, risk severity, and time, you can quickly query information about the specific alerts.
This section describes how to view alert information.
Prerequisites
To check alerts from other cloud services, you need to enable the function of automatically converting logs into alerts on the Data Integration page. If this function is disabled, logs that meet certain alert rules will not be converted to alerts or displayed on the Alerts page. For details, see Enabling Log Access.
Viewing Alert Details
- Log in to the management console.
- Click
 in the upper part of the page and choose Security > SecMaster.
 - In the navigation pane on the left, choose Workspaces > Management. In the workspace list, click the name of the target workspace.
Figure 1 Workspace management page

- In the navigation pane on the left, choose .
Figure 2 Alerts

- View alert information.
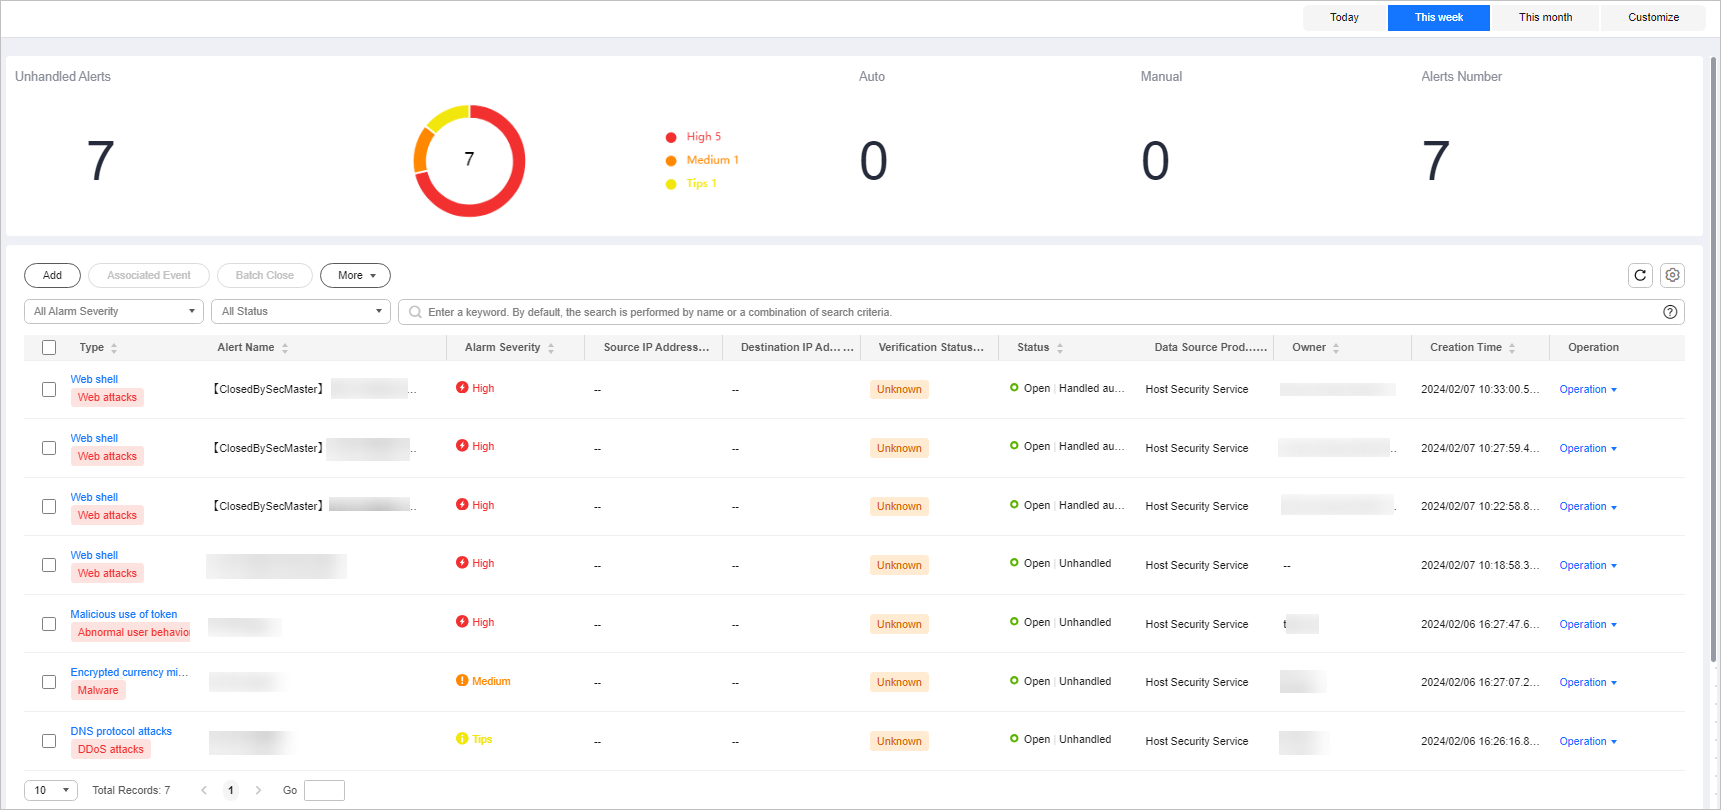
Figure 3 Viewing alerts

Table 1 Viewing Alerts Parameter
Description
Time ranges (Today, This week, This month, or Customize)
In the upper right corner on the page, you can select a time range to view alerts generated during this period. By default, alerts generated in the current week are displayed.
Unhandled Alerts
This area displays how many alerts that are not handled within the specified time range in the current workspace. The unhandled alerts are displayed by severity.
Alerts Handled Automatically (Auto)
This area displays how many alerts that are handled automatically by playbooks within the specified time range in the current workspace.
Alerts Handled Manually (Manual)
This area displays how many alerts that are handled manually within the specified time range in the current workspace.
Alerts
This area displays how many alerts that are reported within the specified time range in the current workspace.
Alarm list
The list displays more details about each alert.
You can view the total number of alerts below the alert list. You can view a maximum of 10,000 alert records page by page. To view more than 10,000 records, optimize the filter criteria.
In the alert list, you can view the alert type, summary, severity, source, and handling status. To view details about an alert, click its name. On the alert details page displayed:
- You can comment on, block, unblock, close, and delete the alert, convert the alert into an incident, and refresh the alert status.
- You can view the security overview, context, relationship, and comments about the alert.
- Security Overview: On this tab, you can view the summary, handling suggestions, basic information, and request details of the alert.
- Context: On this tab, you can view the key and full context information of the alert in JSON format or in a table.
- Relationship: On this tab, you can view associated information, such as associated alerts, incidents, indicator, and affected assets, about the alert.
- Comment: On this tab, you can view historical comments on the alert and make your comments.
Feedback
Was this page helpful?
Provide feedbackThank you very much for your feedback. We will continue working to improve the documentation.See the reply and handling status in My Cloud VOC.
For any further questions, feel free to contact us through the chatbot.
Chatbot


