Viewing Alert Details
Scenarios
On the Alerts page in SecMaster, you can check the alert list for the last 360 days. The list contains alert names, types, severity levels, and occurrence time. By customizing filtering conditions, such as the alert name, risk severity, and time, you can quickly query information about the specific alerts.
On the Alerts page, there are two tabs, Alarm and Attack. The following table lists their differences between.
| Name | Data Source |
|---|---|
| Alarms |
|
| Attacks | Attacks are reported by security products. |
This topic describes how to view alert information.
Prerequisites
To check alerts from other cloud services, you need to enable the function of automatically converting logs into alerts when enabling cloud service access. If this function is disabled, logs that meet certain alert rules will not be converted to alerts or displayed on the Alerts page. For details, see Enabling Log Access.
Viewing Alert Details
- Log in to the SecMaster console.
- Click
 in the upper left corner of the management console and select a region or project.
 - Click
 in the upper left corner of the page and choose Security & Compliance > SecMaster.
 - In the navigation pane on the left, choose Workspaces > Management. In the workspace list, click the name of the target workspace. Figure 1 Workspace management page

- In the navigation pane on the left, choose . Figure 2 Alerts

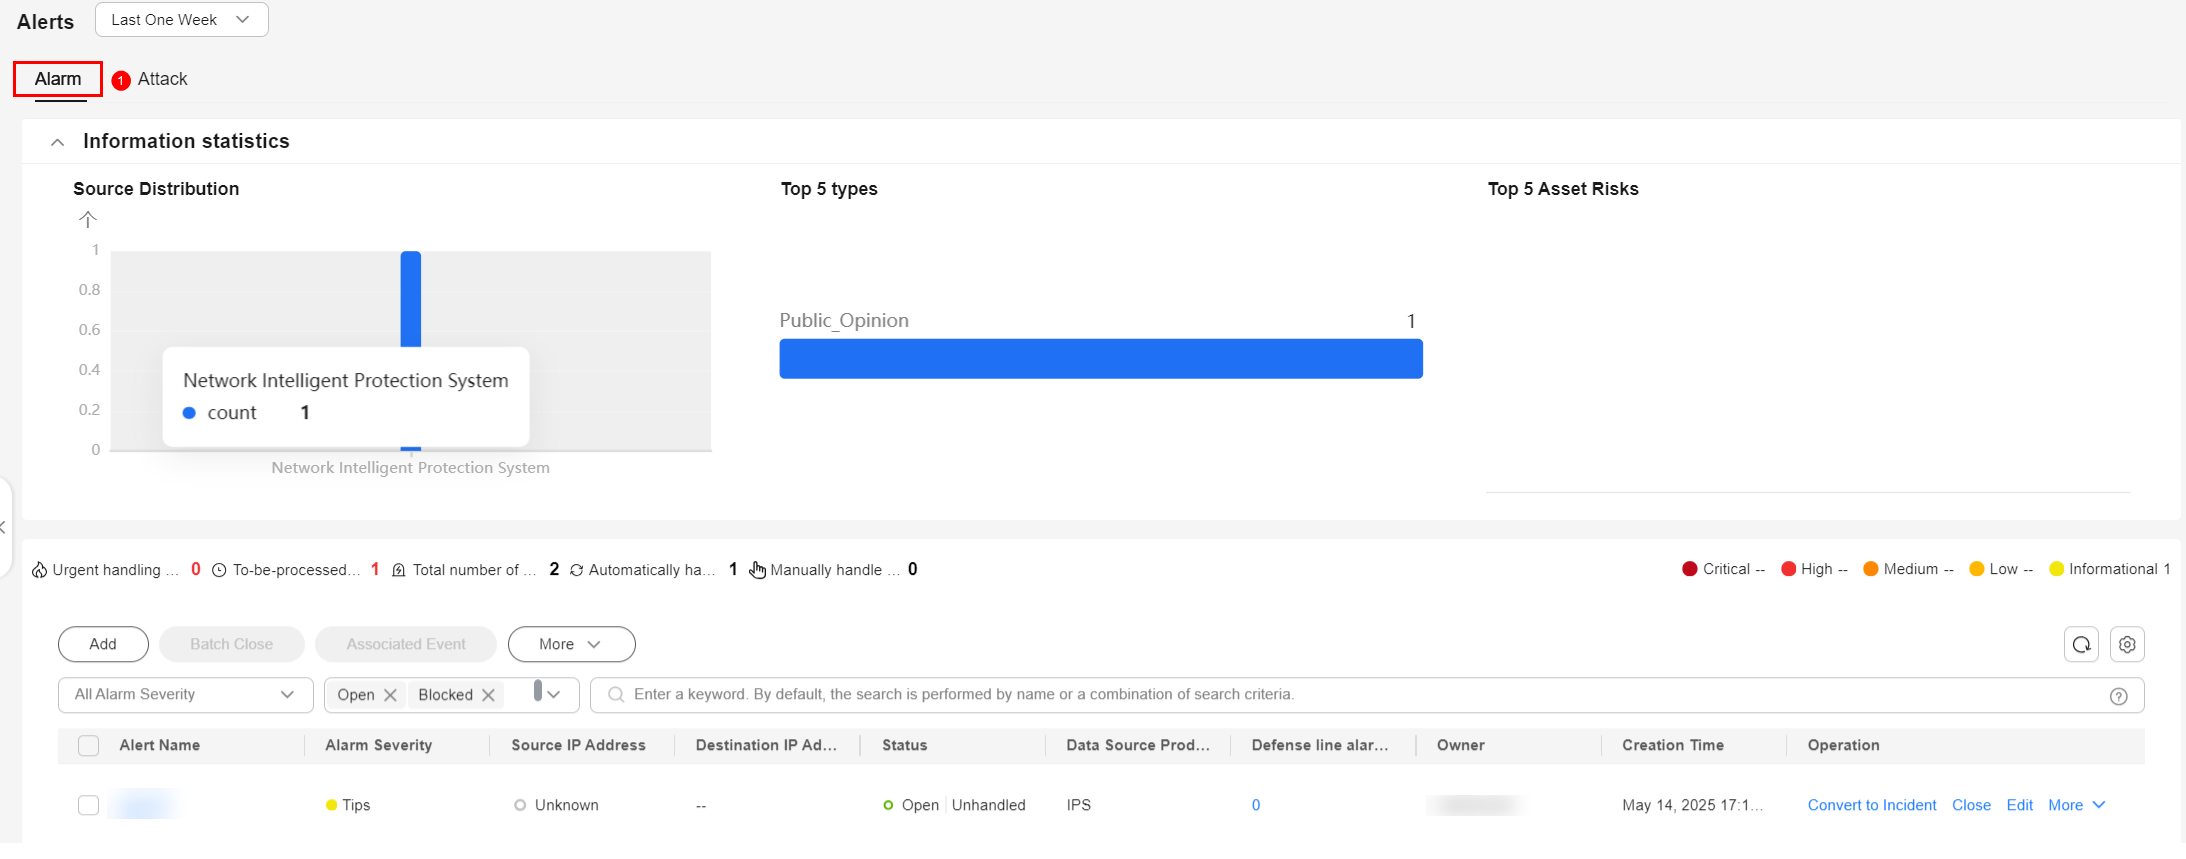
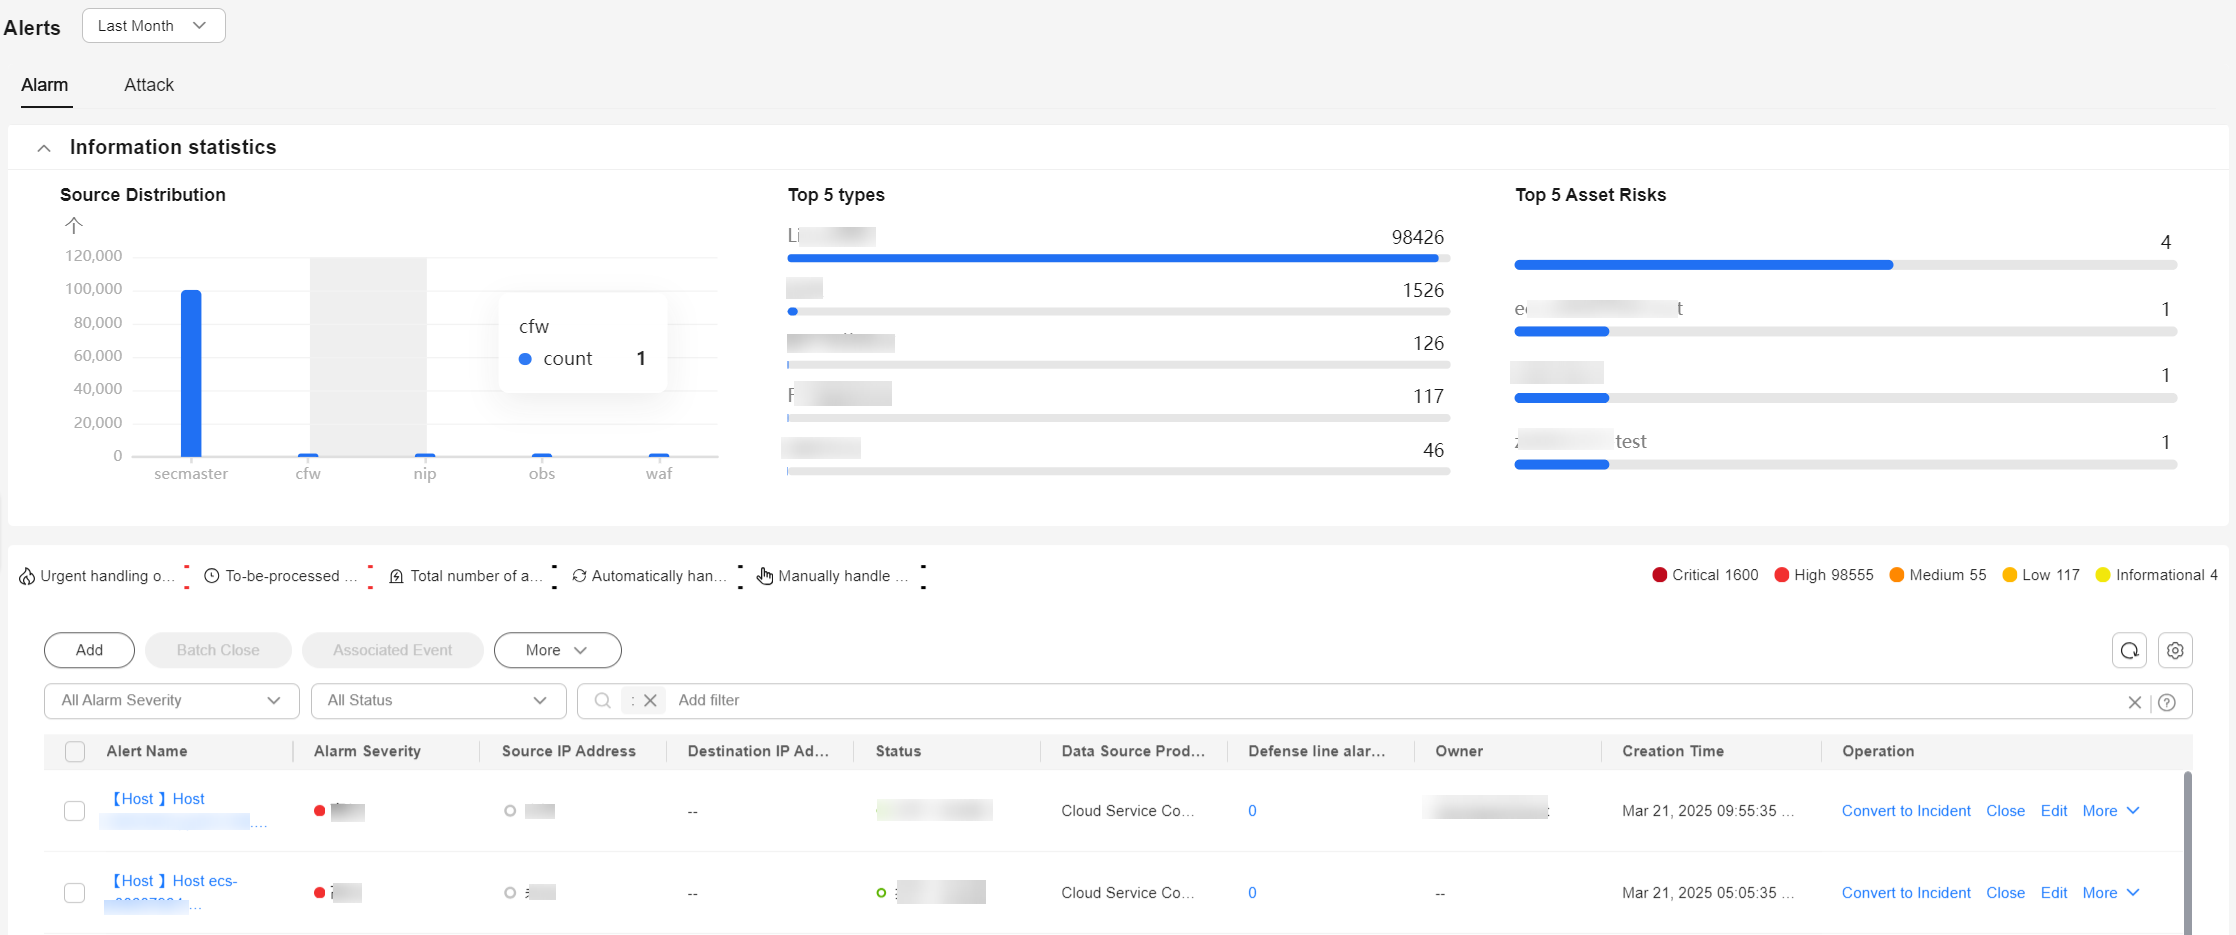
- View alert information. Figure 3 Viewing alerts

Table 2 Viewing alert details Parameter
Description
Time range you select
In the upper left corner on the page, you can select a time range to view alerts generated during this period. By default, alerts generated in the last week are displayed. You can select or customize a time range:
- Last 24 hours
- Last week
- Last month
- Custom: You can customize the start time and end time.
Information statistics
You can query Open or Blocked alerts by:
- Source Distribution: displays the number of alerts by data source with a bar chart.
- Top 5 types: displays the top 5 alert types with the largest number of reported alerts, sorted in descending order.
- Top 5 Asset Risks: displays the five assets with the most alerts.
Urgent handling
Number of alerts in Open or Blocked and marked as High or Critical in the current workspace.
To be processed
Number of alerts that are in the Open or Blocked state and are not handled within the selected time range in the current workspace.
Alerts
This area displays how many alerts are reported within the time range you select in the current workspace.
Alerts Handled Automatically (Auto)
This area displays how many alerts are automatically closed by playbooks within the time range you select in the current workspace.
Alerts Handled Manually (Manual)
This area displays how many alerts are manually closed within the time range you select in the current workspace.
Alert list
You can view the total number of alerts below the alert list. You can view a maximum of 10,000 alert records page by page. To view more than 10,000 records, optimize the filter criteria.
In the alert list, you can view the alert type, severity, source, and handling status. To view details about an alert, click its name. On the alert details page displayed:
You can also click an alert to go to its details page. On the details page, you can edit, comment on, unblock, block, handle, open, block, close, and refresh the alert. You can also convert it into an incident. On the alert details page, you can view Basic Information, Alert Description, Suggestion, and Attack Techniques and Tactics. What you can view depends on the field configuration of the alert model. For details about how to create or edit a model, see Creating and Editing a Model.
The alert details page displays the following information:
- Overview
- Basic Information: displays basic alert information, such as the alert ID, occurrence time, and data source.
- Alert Description: displays alert information configured in the alert model, such as the alert description, confidence, severity, and attack information.
- Suggestions: suggestions for handling the alert.
- Analysis Link: displays analysis name, which is the name of the model that generates the alert.
- Attack Techniques and Tactics: Attack techniques and tactics used are displayed.
- Comments: In this area, you can view historical comments on the alert and make your comments.
- Attack
- Associated Incidents: displays incidents associated with the alert.
- Associated Indicators: displays indicators associated with the alert.
- Associated Assets: displays information about the assets associated with the alert.
Viewing Attack Details
- Log in to the SecMaster console.
- Click
 in the upper left corner of the management console and select a region or project.
 - Click
 in the upper left corner of the page and choose Security & Compliance > SecMaster.
 - In the navigation pane on the left, choose Workspaces > Management. In the workspace list, click the name of the target workspace. Figure 4 Workspace management page

- In the navigation pane on the left, choose . Figure 5 Alerts

- On the Alerts page, click the Attack tab to view attack information.
Table 3 Viewing attack details Parameter
Description
Time ranges you can select.
In the upper left corner on the page, you can select a time range to view alerts generated during this period. By default, alerts generated in the last week are displayed. You can select or customize a time range:
- Last 24 hours
- Last week
- Last month
- Custom: You can customize the start time and end time.
Information statistics
You can query Open or Blocked alerts by:
- Source Distribution: displays the number of alerts by data source with a bar chart.
- Top 5 types: displays the top 5 alert types with the highest number of reported alerts, sorted in descending order.
- Top 5 Asset Risks: displays the top 5 assets with the largest number of alerts.
Urgent handling
Number of alerts in Open or Blocked and marked as High or Critical in the current workspace.
To be processed
Number of alerts that are in the Open or Blocked state and are not handled within the selected time range in the current workspace.
Alerts
This area displays how many alerts are reported within the time range you select in the current workspace.
Alerts Handled Automatically (Auto)
This area displays how many alerts are automatically handled by playbooks within the time range you select in the current workspace.
Alerts Handled Manually (Manual)
This area displays how many alerts are manually closed within the time range you select in the current workspace.
Alert list
You can view the total number of alerts below the alert list. You can view a maximum of 10,000 alert records page by page. To view more than 10,000 records, optimize the filter criteria.
In the alert list, you can view the alert name, severity, type, affected asset, defense status, status, defense line, data source, and last occurrence time.
To view details about an alert, click the alert. The alert details page is displayed.- Overview: displays the alert ID, defense layer/source, attack phase, owner, alert type, and first occurrence time.
- Affected Assets: displays information about the assets affected by the alert. You can check the asset name, region, account name/ID, and enterprise project name/ID.
- Suggestions: suggestions for handling the alert.
- More: displays details about the alert, such as basic information, affected assets, and process information.
- Similar Alerts: displays the list of similar alerts.
Feedback
Was this page helpful?
Provide feedbackThank you very much for your feedback. We will continue working to improve the documentation.


