

Viewing MRS Node Resource Monitoring Metrics
During routine MRS cluster O&M, administrators must monitor node running status and resource consumption in real time. If a cluster encounters performance bottlenecks, node faults, or insufficient resources, you can view node resource monitoring metrics to quickly identify faulty nodes and analyze CPU, memory, disk, and network resource usage trends. This data helps support capacity planning and troubleshooting. This section describes how to view node resource monitoring metrics on the MRS console and MRS Manager.
Viewing Host Monitoring Charts
Operations on the MRS management console:
- Log in to the MRS console.
- On the Active Clusters page, select a running target cluster and click its name to go to the cluster details page.
- On the Dashboard page, click Synchronize next to IAM User Sync to synchronize IAM users.
- Click Nodes and expand the node group information to view the status of all hosts.
- The host list of a group contains the Node Name/Resource ID, IP, Status, Specifications, Disks, and AZ.
- Click the target node in the list to view its status and metric information.
- Click the Monitoring tab to view the monitoring charts of the current node.
- MRS 3.x and later:
- Log in to FusionInsight Manager of the MRS cluster.
For details about how to log in to FusionInsight Manager, see Accessing MRS Manager.
- Click to view the host list.
- In the host list, click the specified host name to view the host overview information.
The host details page contains the basic information area, disk status area, instance list area, and monitoring charts.
- Click the Chart tab to view the full monitoring chart information about the host.
The Chart page displays all monitoring charts of the host.
- Log in to FusionInsight Manager of the MRS cluster.
- MRS 2.x and earlier:
- Log in to FusionInsight Manager of the MRS cluster.
For details about how to log in to FusionInsight Manager, see Accessing MRS Manager.
- Click Hosts to view the status of all hosts.
- Click the target host in the host list to view its status and metric information.
- Customize and export monitoring charts.
- In the Charts area, click Customize to customize service monitoring metrics.
- In the Period area, select a time period and click View to display the monitoring data for that period.
- Click Export to export the displayed metrics.
- Log in to FusionInsight Manager of the MRS cluster.
Viewing Host Resource Overview
This function is only available in MRS 3.x or later.
- Log in to FusionInsight Manager of the MRS cluster.
For details about how to log in to FusionInsight Manager, see Accessing MRS Manager.
- Choose Hosts > Resource Overview to view the resource distribution information.
In the Distribution tab, you can view the resource distribution of the cluster. By default, the monitoring data of the last hour is displayed. You can click
 to set a time range.Figure 1 Distribution tab
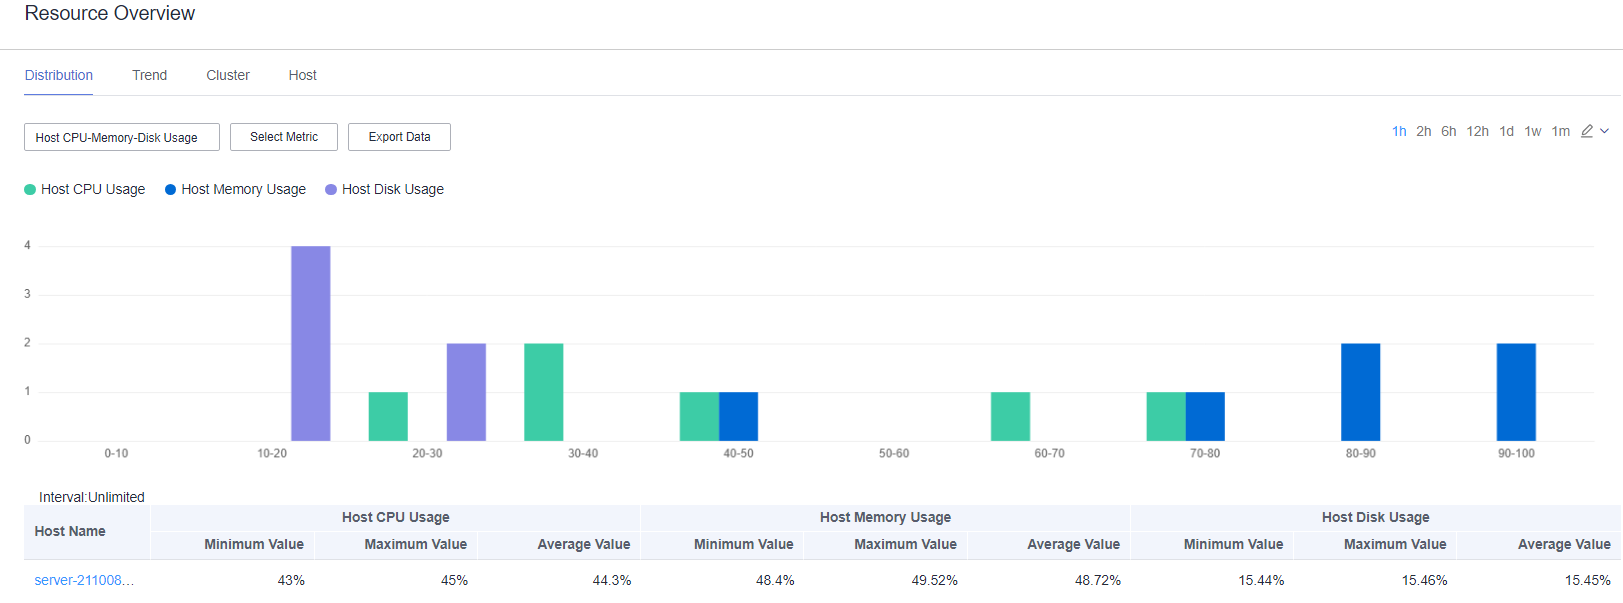
- Click Select Metric to specify the metrics you want to check. After you select a metric, the host distribution in each range of the metric is displayed.
- When you place the cursor on a color column, the number of hosts in the range is displayed. You can click a color column to view the list of hosts in the metric range.
- You can click a host name in the Host Name column to access the host details page.
- Click View Trends of a host in the Operation column of the list. The metric trends will be displayed. In the current cluster, if you have selected Host CPU-Memory-Disk Usage, View Trends is unavailable.
- You can click Export Data to export the maximum, minimum, and average values of the current metric of all nodes in the cluster within the time range you have specified.
Table 1 Metrics Category
Metric
Process
- Number of Running Processes
- Total Number of Processes
- Total Number of omm Processes
- Total Number of Processes in D and Z States
Network Status
- Host Network Packet Collisions
- Number of LAST_ACK States
- Number of CLOSING States
- Number of LISTENING States
- Number of CLOSED States
- Number of ESTABLISHED States
- Number of SYN_RECV States
- Number of TIME_WAITING States
- Number of FIN_WAIT2 States
- Number of FIN_WAIT1 States
- Number of CLOSE_WAIT States
- DNS Name Resolution Duration
- TCP Ephemeral Port Usage
- Host Network Packet Frame Errors
Network Reading
- Host Network Read Packets
- Host Network Read Dropped Packets
- Host Network Read Error Packets
- Host Network Receiving Rate
Disk
- Host Disk Write Rate
- Host Used Disk
- Host Free Disk
- Host Disk Read Rate
- Host Disk Usage
Memory
- Free Memory
- Cache Memory Size
- Total Kernel Cache Memory Size
- Shared Memory Size
- Host Memory Usage
- Used Memory
Network Writing
- Host Network Write Packets
- Host Network Write Error Packets
- Host Network Sending Rate
- Host Network Write Dropped Packets
CPU
- CPU Usage of Processes Whose Priorities Have Been Changed
- CPU Usage of User Space Processes
- CPU Usage of Kernel Space Processes
- Host CPU Usage
- CPU Total Time
- CPU Idle Time
Host Status
- Host File Handle Usage
- Average OS Load in 1 Minute
- Average OS Load in 5 Minutes
- Average OS Load in 15 Minutes
- Host PID Usage
- Click the Trend tab to view host monitoring trends.
The resource monitoring trend page of the cluster is displayed. By default, the monitoring data of the past one hour (1h) is displayed. You can click
 to set a time range.Figure 2 Trend tab
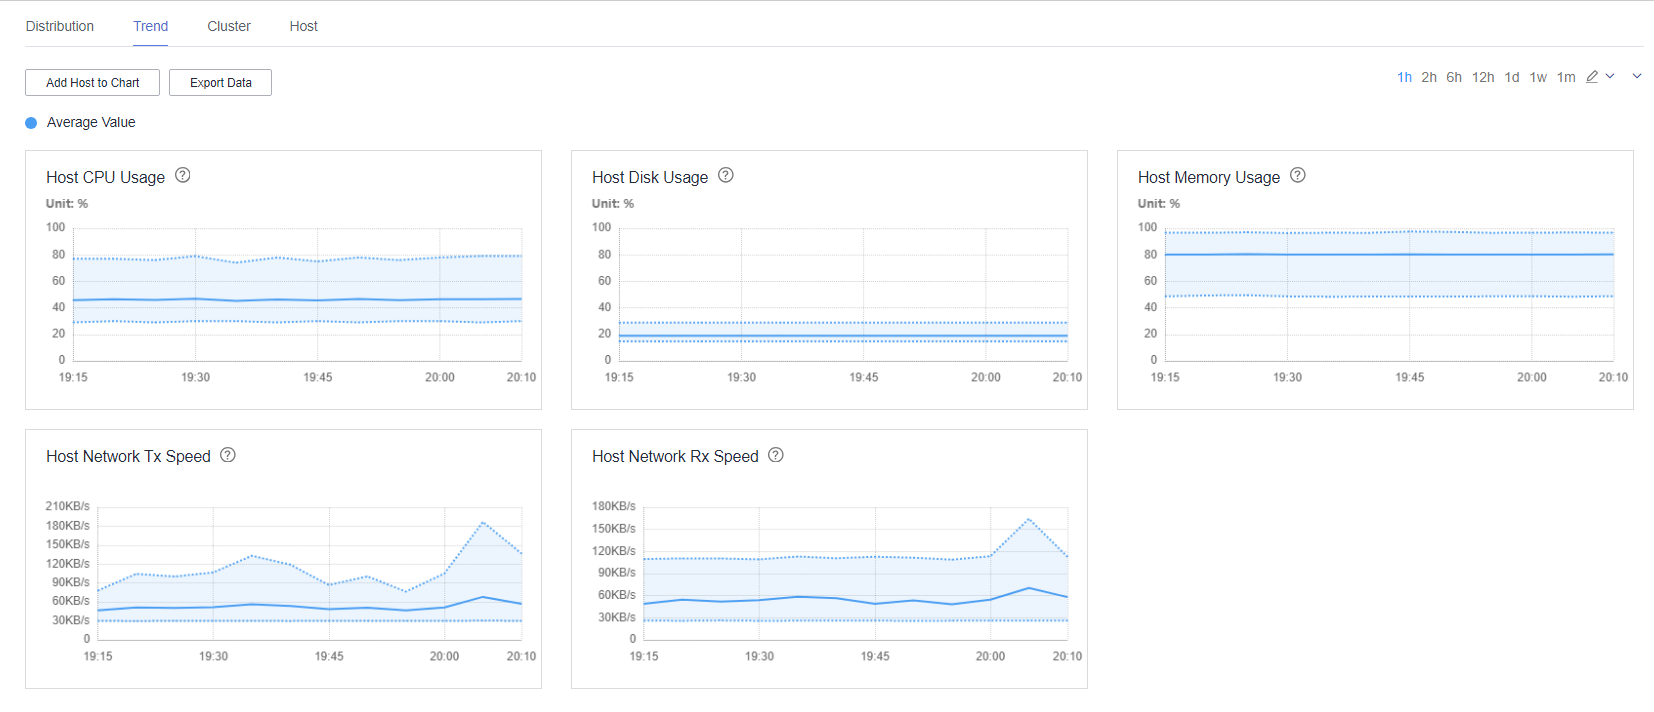
- You can click Add Host to Chart to add trend lines of up to 12 hosts to the trend charts.
- Click
 and Customize to select the metrics to be displayed on the page.
- You can click Export Data to export the maximum, minimum, and average values of all nodes in the cluster for all selected metrics within the time range you have specified.
- Click the Cluster tab to view the cluster information.
You can view the resource monitoring page of each cluster on FusionInsight Manager at the same time.
By default, the monitoring data of the past one hour (1h) is displayed. You can click
 to set a time range.Figure 3 Cluster tab
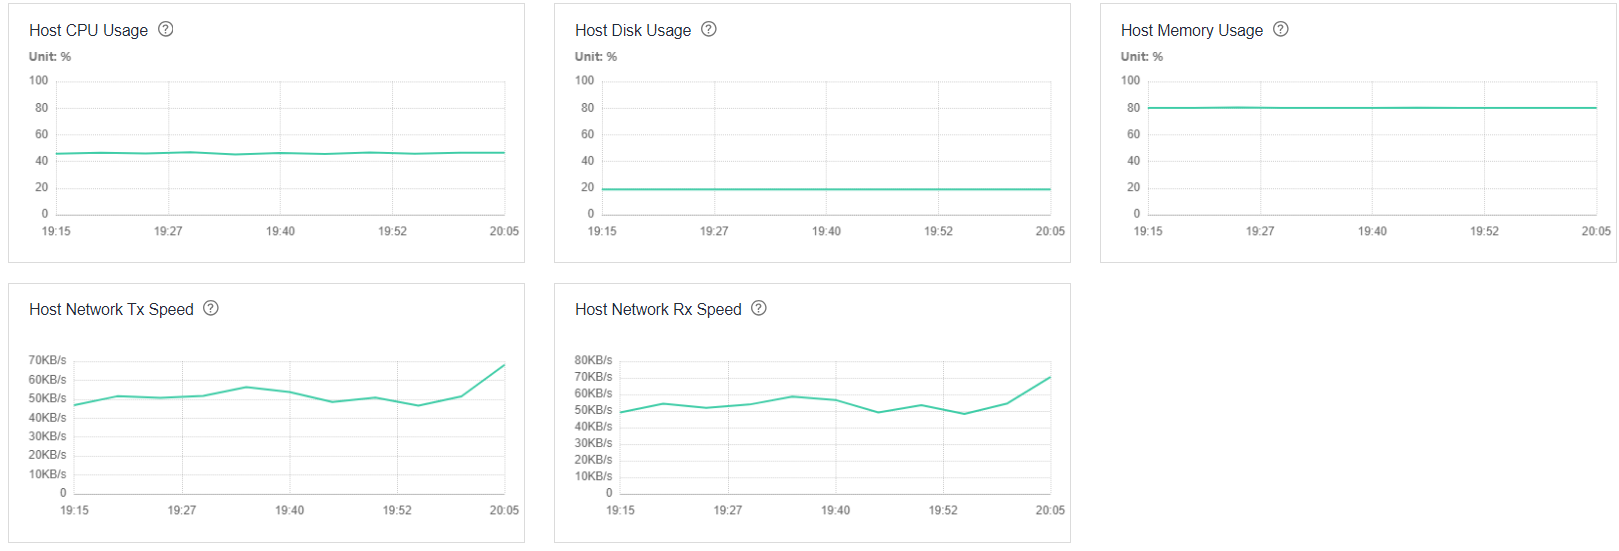
- Click
 and Customize to select the metrics to be displayed on the page.
- You can click Export Data to export the metric values of each cluster within the time range you have specified.
- Click
- Click the Host tab to view the host information.
You can view the host resource status, including basic configuration (CPU/memory) and disk configuration.
Click Export Data to export the configuration list of all hosts in the cluster.
Figure 4 Host tab
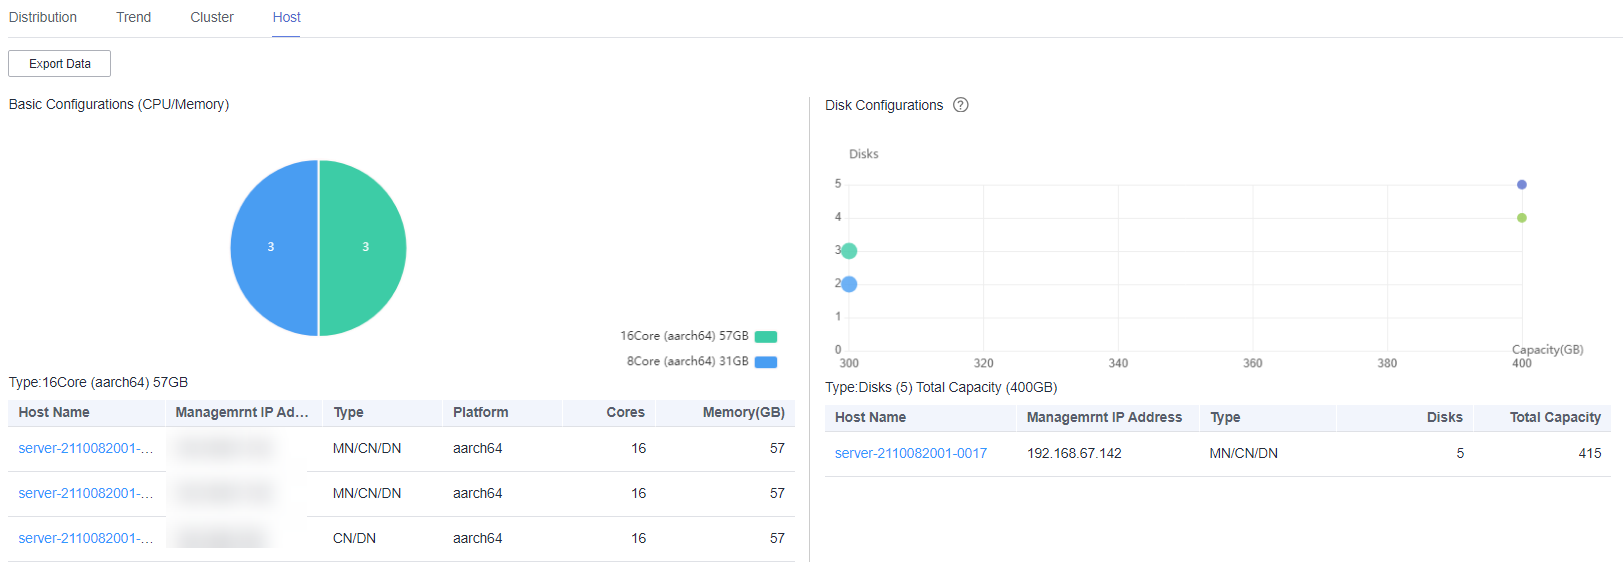
- Basic Configurations (CPU/Memory)
You can hover your cursor over the pie chart to view the number of hosts of each hardware configuration in the cluster. The information is displayed in the format of Number of cores (CPU architecture) Memory size.
You can click a slice on the pie chart to view the list of hosts.
- Disk Configurations
The horizontal axis indicates the total disk capacity (including the OS disk) of a node, and the vertical axis indicates the number of logical disks (including the OS disk).
You can hover your cursor over a dot to view information about disks of the current configuration, including the quantity of disks, total capacity, and number of hosts.
You can click a dot on the chart to view the list of hosts.
- Basic Configurations (CPU/Memory)
- Verify that the monitoring data displays correctly.
- MRS console: On the Monitor tab, verify that all charts load and display metric data properly.
- MRS Manager: Check the Distribution, Trend, Cluster, and Host tabs to ensure monitoring data and charts load without errors.
- Exported reports: If you export monitoring data, verify that the exported file includes the maximum, minimum, and average values for your selected time range.
FAQs
- Q: What should I do if monitoring chart data is missing or displayed abnormally?
Check the following items: Ensure that IAM user synchronization is complete when viewing data on the management console. Verify that the cluster is in the running state, and ensure that your browser is not blocking chart content. If the issue persists, clear your browser cache or try a different browser.
- Q: What should I do if the View Trends operation is unavailable in the resource overview?
The View Trends option is disabled when the Host CPU-Memory-Disk Usage metric is selected. This is a system restriction. To view trend charts, select a different metric.
- Q: What should I do if an exported monitoring report is empty?
Ensure that the cluster was running during your selected time range. If the selected time range is too short or the cluster has just started, insufficient monitoring data may have been collected. Extend the time range and try exporting again.
Helpful Links
- For details about how to log in to MRS Manager, see Accessing MRS Manager.
- For details about how to log in to an MRS cluster node, see Logging In to an MRS Cluster Node.
- For details about how to view cluster health check information, see Performing a Health Check for an MRS Cluster.


