Introduction to MRS Manager
MRS manages and analyzes massive amounts of data and quickly mines valuable data from structured and unstructured data. Open source components have complex structures and therefore they are difficult to install, configure, and manage. MRS Manager is a unified enterprise-level cluster management platform that provides:
- Cluster monitoring: enables you to quickly learn the running status of hosts and services.
- Graphical metric monitoring and customization: enable you to obtain key system information in a timely manner.
- Service property configurations can meet service performance requirements.
- Cluster, service, and role instance operations: allow you to start or stop services and clusters with just a few clicks.
- Rights management and audit: allow you to configure the access control and manage operation logs.
MRS Manager Homepage
MRS Manager provides a unified cluster management platform, facilitating rapid and easy O&M for clusters.
The MRS Manager GUI contains three parts: the operation bar at the top, the display area in the middle, and the taskbar at the bottom. The operation bar has multiple entries, each with its unique function. These functions are explained in the table below.
| Entry | Function |
|---|---|
| Homepage | Displays key monitoring metrics of clusters and host statuses in column charts, line charts, and tables. You can customize a dashboard to display key monitoring metrics and drag and drop it anywhere on the GUI. Data on the dashboard can be automatically refreshed. |
| Cluster | Provides guidance on how to monitor, operate, and configure services in a cluster, helping you manage services in a unified manner. |
| Hosts | Provides guidance on how to monitor and operate hosts, helping you manage hosts in a unified manner. |
| O&M | Provides guidance on how to query and handle alarms, helping you identify and rectify product faults and potential risks in a timely manner to ensure normal system operations. |
| Audit | Allows you to query and export audit logs, and view all user activities and operations. |
| Tenant Resources | Provides a unified tenant management platform. |
| System | Provides system management settings for MRS Manager, such as user permission settings. |
On the MRS Manager homepage, you can view the cluster service status, monitoring reports, and alarm statistics and analysis information in the preview area.
- In the upper right corner of the homepage, you can view the number of alarms of different severities, number of running tasks, current user, and help information. Figure 1 shows the related area.
Click
 to view the task name, status, progress, start time, and end time of the last 100 operation tasks in Task Management Center.
For a start, stop, restart, or rolling restart task, you can abort it by clicking the task name in the task list, clicking Abort, and then entering the system administrator password in the dialog box that is displayed. An aborted task is no longer executed.
- The taskbar at the bottom of the homepage displays the language options of FusionInsight Manager and the current cluster time and time zone information. You can switch the system language as needed. Figure 2 Taskbar at the bottom of the homepage

- Service status preview area
The list of installed service components in the cluster is displayed on the left of the homepage. You can view the status and alarms of each service.
The
 icon on the left of each service name indicates that the service is running properly; the
  icon indicates that the current service fails to start; and the
  icon indicates that the current service is not started.
You can also check whether alarms have been generated for the service on the right of the service name. If alarms have been generated, the alarm severities and the number of alarms are displayed.
The
 icon displayed on the right of the service name indicates that the service configuration has expired.
 - Monitoring status report area
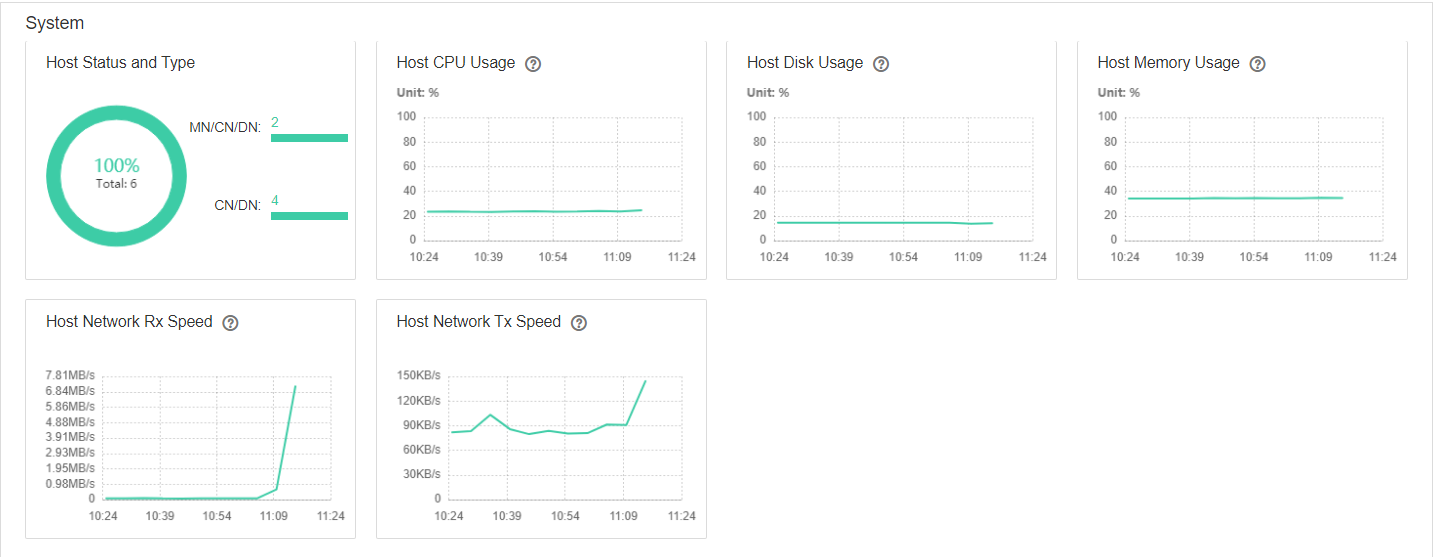
The chart area is on the right of the homepage, which displays key monitoring metric reports, such as the status of all hosts in the cluster, host CPU usage, and host memory usage. You can customize the monitoring reports displayed in the chart area. For details, see Viewing MRS Cluster Resource Monitoring Metrics.
You can view the data source of a monitoring chart in the lower left corner of the chart. You can zoom in on a monitoring report to view chart values more clearly or close the monitoring report.
Figure 3 Monitoring status report
- Alarm analysis
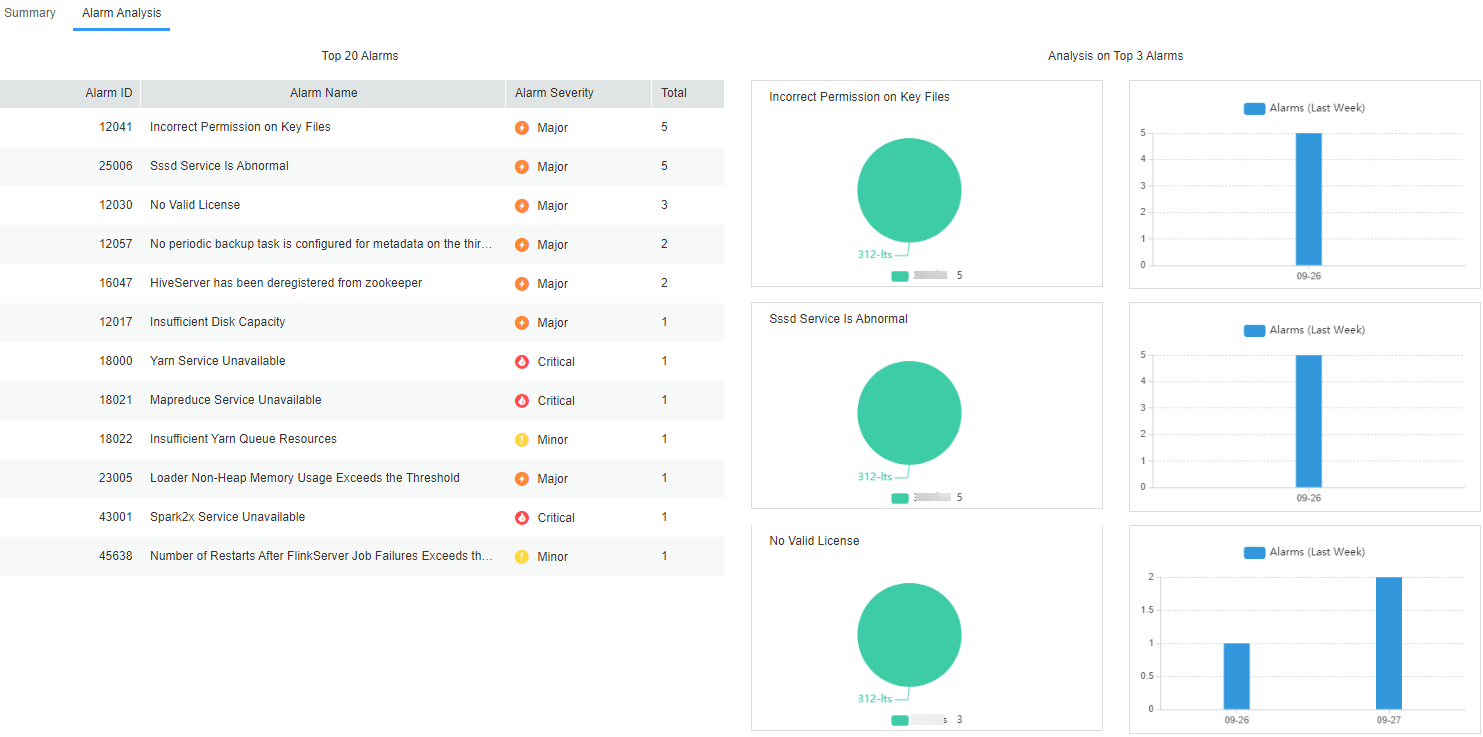
On the Alarm Analysis page, you can view the Top 20 Alarms table and Analysis on Top 3 Alarms chart. You can click an alarm name in the Top 20 Alarms table to view analysis information of this alarm only. Alarm analysis allows you to view top alarms and their occurrence time so you can handle alarms accordingly, improving system stability.

For MRS 3.3.0 and later versions, the alarm information page is different from that of other versions.
Figure 4 Alarm analysis
Checking the MRS Manager Version
By checking the MRS Manager version, you can get ready for system upgrades and regular maintenance.
The following operations use an MRS cluster of 3.x or later as an example.
- Using the GUI:
Log in to MRS Manager of the MRS cluster. On the homepage, click
 in the upper right corner and choose About from the drop-down list. In the dialog box that is displayed, check the MRS Manager version.Figure 5 Checking the MRS Manager version
- Using the CLI:
- Log in to the Manager active OMS node as user root.
To obtain the IP address of the active OMS node, view the host information marked with
 on the Hosts page of Manager.
 - Check the version and platform information of Manager.
su - omm
cd ${BIGDATA_HOME}/om-server/om/sbin/pack./queryManager.sh
After the query script is executed, the following information is displayed:
     Version             Package                                                          Cputype
     ***                 FusionInsight_Manager_***                                         x86_64
- Log in to the Manager active OMS node as user root.
Feedback
Was this page helpful?
Provide feedbackThank you very much for your feedback. We will continue working to improve the documentation.


