Viewing the Asset Overview
The Dashboard page contains two tabs, Assets and Asset Reports.
- The Assets tab page displays information about logical assets, technical assets, and metric assets.
-
Logical assets come from logical entities and data tables defined and released in DataArts Catalog. The number and details of business objects, logical entities, and business attributes are displayed on the Assets page.
-
Technical assets come from data connections and metadata collection tasks. The number and details of databases, data tables, and data volumes are displayed on the Assets page.
-
Metric assets come from business metrics defined and released in DataArts Architecture. The number and details of business metrics and their details are displayed on the Assets page.
-
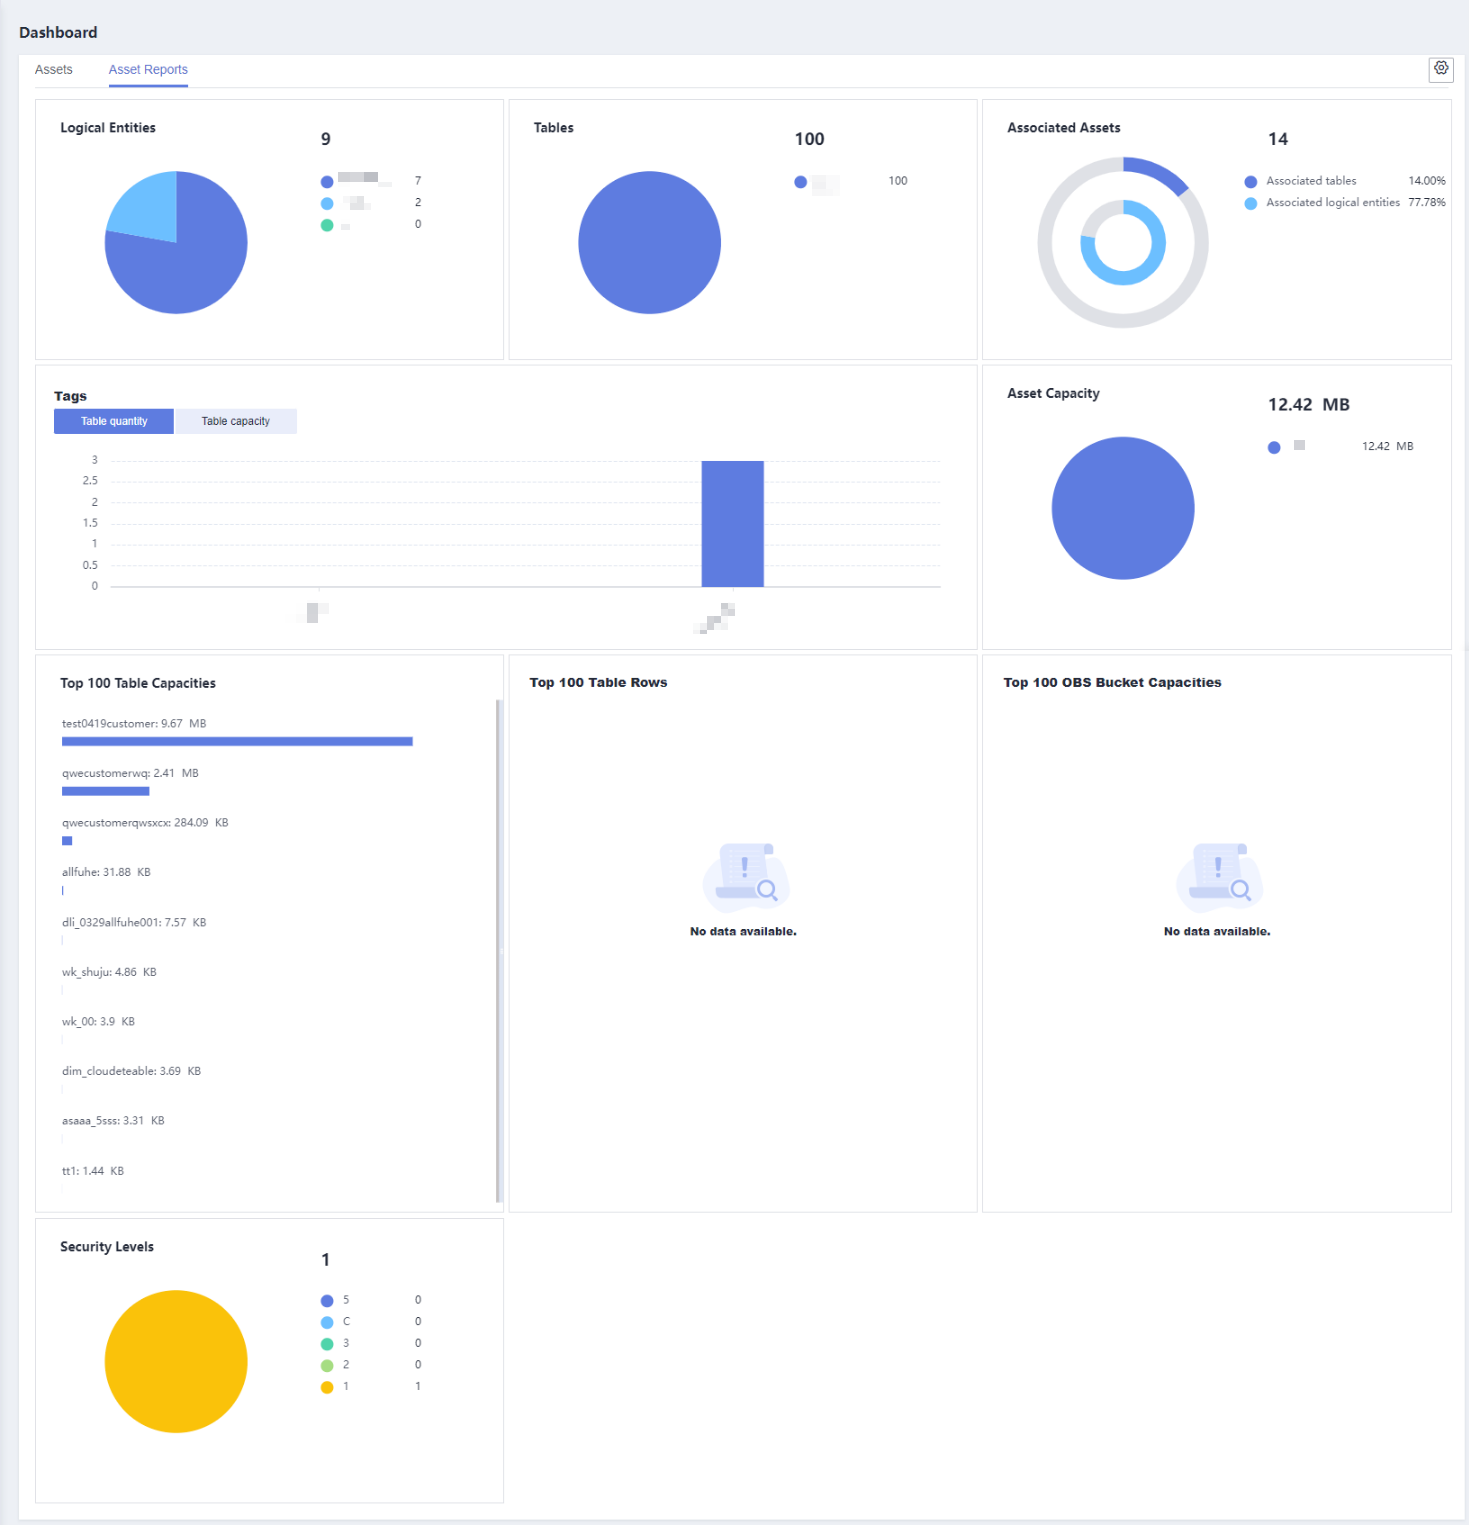
- The Asset Reports tab page displays logical entities, data tables, asset associations, asset capacities, tags, security levels, top 100 tables by capacity and number of rows, and top 100 buckets by capacity.
Constraints
- Logical assets and metric assets come from DataArts Architecture and are updated if data is synchronized from DataArts Architecture. However, they cannot be deleted directly in DataArts Architecture. Instead, you must locate and delete them in DataArts Catalog.
- Data connections in technical assets come from Management Center and are updated if data is synchronized from Management Center. However, they cannot be deleted directly in Management Center. Instead, you must locate and delete them in DataArts Catalog.
- Information such as databases, tables, and columns in technical assets come from metadata collection tasks. Whether to update and automatically delete such information depends on the parameter settings of metadata collection tasks. For details, see Configuring a Metadata Collection Task.
- Data lineages in technical assets are updated by job scheduling. Data lineages are generated based on the latest job instances. To delete data lineages, you need to delete jobs or job metadata. Stopping jobs alone does not delete data lineages.
Prerequisites
- Logical entities, data tables, and business metrics have been defined and released in DataArts Architecture.
- A collection task has been created and executed successfully. For details about how to create a collection task, see Creating a Collection Task.
Assets
- Log in to the DataArts Studio console by following the instructions in Accessing the DataArts Studio Instance Console.
- On the DataArts Studio console, locate a workspace and click DataArts Catalog.
- Choose .
Figure 1 Assets

- Click Logical Assets to view details about logical assets.
Logical assets come from logical entities and data tables defined and released in DataArts Catalog. The number and details of business objects, logical entities, and business attributes are displayed on the Assets page.
- Click Technical Assets to view details about technical assets.
Technical assets come from data connections and metadata collection tasks. The number and details of databases, data tables, and data volumes are displayed on the Assets page.
- Click Metric Assets to view details about metric assets.
Metric assets come from business metrics defined and released in DataArts Architecture. The number and details of business metrics and their details are displayed on the Assets page.
Asset Reports
- On the DataArts Studio console, locate a workspace and click DataArts Catalog.
- Choose and click Asset Reports.
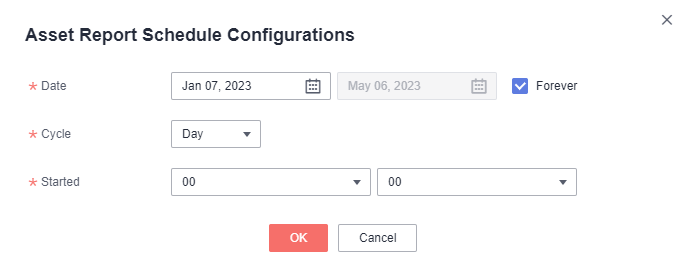
- If you access the Asset Reports page for the first time, you need to configure asset report tasks. Click
 in the upper right corner. The Asset Report Schedule Configurations dialog box is displayed.
Set Date, Cycle, and Started. The system will run asset report tasks based on the configuration and update the asset reports.Figure 2 Configuring asset report tasks
- After the system schedules and runs asset report tasks, you can go to the Asset Reports page again to view the logical entities, data tables, asset associations, asset capacities, tags, security levels, top 100 tables by capacity and number of rows, and top 100 buckets by capacity.
Figure 3 Asset Reports

Feedback
Was this page helpful?
Provide feedbackThank you very much for your feedback. We will continue working to improve the documentation.


