Creating an Alarm Rule and Notifications
To monitor the usage of cloud service resources or key operations on them, you can create an alarm rule. After the alarm rule is created, if a metric reaches the specified threshold or the specified event occurs, Cloud Eye immediately informs you of the exception through SMN.
This topic describes how to create an alarm rule.
Prerequisites
Alarm Type | Prerequisites |
|---|---|
Metric |
|
Event | Before creating an alarm rule for a custom event, ensure that the event source is the same as that specified in Reporting Events. |
Creating an Alarm Rule
- Log in to the Cloud Eye console.
- In the navigation pane, choose Alarm Management > Alarm Rules.
- Click Create Alarm Rule in the upper right corner.
- On the Create Alarm Rule page, configure parameters.
- Configure basic information about the alarm rule. Figure 1 Basic information

Table 1 Parameter description Parameter
Description
Name
Name of the alarm rule. The name is automatically generated, but you can change it to a custom one. The rule name cannot exceed 128 characters and can contain only letters, digits, underscores (_), and hyphens (-).
Description
(Optional) Alarm rule description. It can contain up to 256 characters.
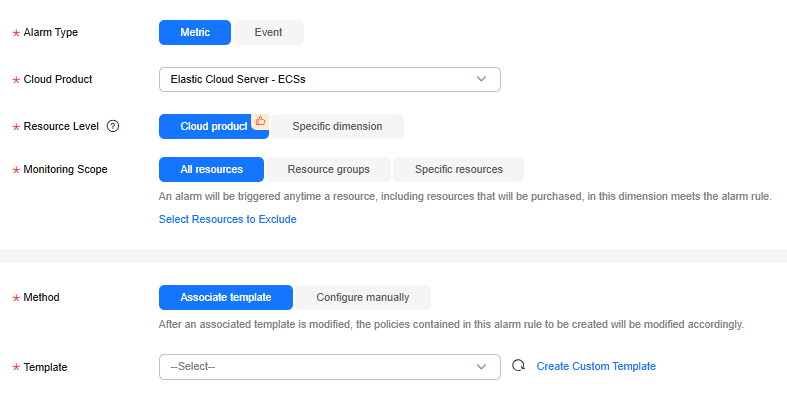
- Select monitored objects and configure alarm parameters. Figure 2 Configuring an alarm rule

Table 2 Alarm rule parameters Parameter
Description
Example Value
Alarm Type
Alarm type to which the alarm rule will apply. The type can be Metric or Event. For details about how to select an alarm type, see Table 1.
Metric
Cloud Product
Select the cloud product you want to monitor. This parameter is only available if you select Metric for Alarm Type.
For details about supported cloud products and their metrics, see Cloud Product Metrics.
Elastic Cloud Server - ECSs
Resource Level
Resource level of the monitored object. This parameter is only available if Alarm Type is set to Metric. The value can be Cloud product (recommended) or Specific dimension.
Take ECS as an example. ECS is the cloud product. Specific dimensions are disks, mount points, processes, and more.
NOTE:If you select Cloud product, metrics across dimensions (such as Disk Usage and CPU Usage) can be configured in the same alarm rule. If you select Specific dimension, only metrics of the specified dimension can be configured for the same alarm rule.
Cloud product
Monitoring Scope
Monitoring scope the alarm rule applies to.
- All resources: An alarm will be triggered if any resource of the selected cloud product meets the alarm policy. To exclude resources that do not need to be monitored, click Select Resources to Exclude.
- Resource groups: An alarm will be triggered if any resource in the selected resource group meets the alarm policy. To exclude resources that do not need to be monitored, click Select Resources to Exclude.
- Specific resources: Click Select Specific Resources to select resources.
NOTE:- If Alarm Type is set to Metric, you can select Resource groups, All resources, or Specific resources.
- If Alarm Type is set to Event and Event Type is set to System event, you can configure the monitoring scope. Currently, Resource groups is only available for DDS, RDS, and DCS event alarms.
Specific resources
Group
When Monitoring Scope is set to Resource groups, you need to select a group. If no resource group meets your needs, click Create Resource Group to create one.
After selecting a resource group from the drop-down list, you can click View Resources in a Group to view the details of resources in the group. After an alarm rule is configured, the group cannot be modified.
NOTE:If the resource group contains an EVS resource with the type in the format of ECS instance ID-volume-Volume ID, the instance cannot report monitoring data after the alarm rule is created. As a result, no alarm can be triggered.
-
Instance
When Monitoring Scope is set to Specific resources, you need to select the monitored objects for the alarm rule.
Click Select Specific Resources to select desired resources.
-
Event Type
This parameter is only available if Alarm Type is set to Event. You can select either System event or Custom event. For details about the events supported by each cloud service, see Events Supported by Event Monitoring.
System event
Event Source
This parameter is only available if Alarm Type is set to Event.
- If Event Type is set to System event, select the cloud service from which the event comes.
- If Event Type is set to Custom event, the event source must be the same as that of the reported source and written in the service.item format. For details about how to report an event, see Reporting Events.
Elastic Cloud Server
Method
Select a method for configuring an alarm rule. For metric alarm rules or system event alarm rules, you can customize a policy or use a preset template to create one. For custom event alarm rules, you can only customize a policy.
- Configure manually: You can create a custom alarm policy as needed.
- Associate template: If you need to configure the same alarm rule for multiple groups of resources under the same cloud product, you can use an alarm template to simplify operations.
Configure manually
Template
When you set Method to Associate template, you need to select a template.
You can select a default or custom template.
NOTE:An alarm template may contain alarm policies of multiple cloud products or different dimensions of the same cloud product. When you create an alarm rule, the alarm policies vary according to the resource level.
- When you set Resource Level to Cloud product, all alarm policies of the cloud product in the alarm template will be synchronized to the alarm rule.
- When you set Resource Level to Specific dimension, only alarm policies of the same dimension as the current resource in the alarm template will be added to the alarm rule.
-
Alarm Policy
When you set Method to Configure manually, you need to configure alarm policies.
- When you set Alarm Type to Metric, whether to trigger an alarm depends on whether the data in consecutive periods reaches the threshold. For example, Cloud Eye triggers an alarm if the average CPU usage of the monitored object is 80% or more for three consecutive 5-minute periods.
- If Alarm Type is set to Event and a specified event occurs, an alarm is triggered. For example, an alarm is triggered if a VM is restarted.
For details about alarm policy parameters, see Alarm Policies.
You can add up to 50 alarm policies for a single alarm rule. You can choose to send alarm notifications when any of the policies is met or when all policies are met.
-
Alarm Severity
Alarm severity, which can be Critical, Major, Minor, or Warning.
Major
- Configure alarm notifications.
Table 3 Parameters for configuring alarm notifications Parameter
Description
Alarm Notifications
Whether to send alarm notifications by SMS, email, HTTP, or HTTPS. This parameter is enabled by default.
Recipient
Target recipient of alarm notifications. You can select the account contact or a topic. This parameter is available only if Notified By is set to Topic subscriptions. If there is a display name of a topic, the format is Topic name (Display name), and you can search for a topic by name or display name. If no display name is set for a topic, only the topic name will be displayed.
- The account contact is the mobile number and email address of the registered account.
- A topic is used to publish messages and subscribe to notifications. If there is no topic you need, create one first and add subscriptions to it. For details, see Creating a Topic and Adding Subscriptions.
Notification Window
If Notified By is set to Notification groups or Topic subscriptions, you need to set the notification window.
Cloud Eye sends notifications only within the validity period specified in the alarm rule.
For example, if the notification window is set to 08:00:00 to 20:00:00, notifications are sent only within this specified time range when a metric reaches the specified threshold or a specified event occurs.
Time Zone
Time zone for the alarm notification window. By default, it matches the time zone of the client server, but can be manually configured.
Trigger Condition
This parameter is required when you set Notified By to Notification groups or Topic subscriptions.
- If you set Alarm Type to Metric, select Generated alarm, Cleared alarm, or both for this parameter.
- If you set Alarm Type to Event, you can only select Generated alarm for this parameter.
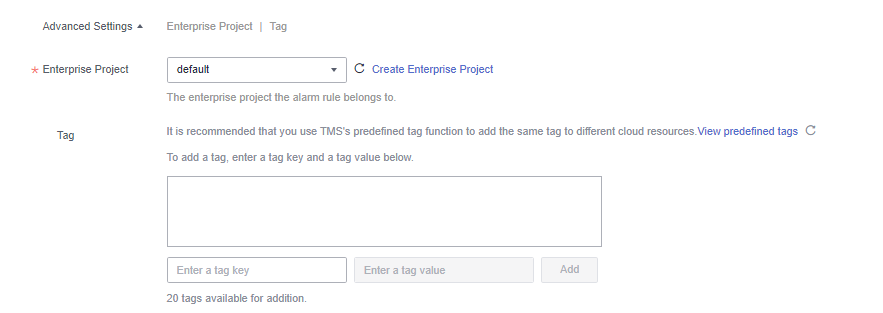
- Set parameters in Advanced Settings. Figure 3 Advanced settings

Table 4 Parameter description Parameter
Description
Enterprise Project
Enterprise project that the alarm rule belongs to. Only users with the enterprise project permissions can manage the alarm rule. For details about how to create an enterprise project, see Creating an Enterprise Project.
Tag
Key-value pairs that you can use to easily categorize and search for cloud resources. You are advised to create predefined tags in TMS. For details, see Creating Predefined Tags.
- A key can contain up to 128 characters, and a value can contain up to 225 characters.
- You can create up to 20 tags.
- Click Create.
After the alarm rule is created, if a metric reaches the specified threshold, Cloud Eye immediately informs you of the exception through SMN.
Feedback
Was this page helpful?
Provide feedbackThank you very much for your feedback. We will continue working to improve the documentation.


