Overview
Overview concludes Resource Monitoring. You can learn about resource alarms of each cloud service in real time.
Constraints
The Overview page aggregates data from all resources. When you enable enterprise project authorization, it also includes data that is not managed by the current enterprise project. If you want to view a specific resource, a message will be displayed indicating insufficient permissions.
Viewing Cloud Service Resource Monitoring
Resource Monitoring displays real-time alarms of each resource group and cloud service. You can view resource alarms in different dimensions to efficiently manage resources. The following describes how you can use Resource Monitoring.
- Log in to the Cloud Eye console.
- Choose Overview.
- On the upper left corner of the Overview page, view the total number of resources and and identify how many of them have active alarms.
- On the left of Resource Monitoring, view the health score of all resources, total number of resources, total number of resources with active alarms, as well as the number of resources at different alarm severities.

- Health score = (Number of resources without alarms/Total number of resources) x 100 (rounded down to an integer)
- The new overview page uses a different statistical method than the old one. This means the total resource count and the number of resources with active alarms may differ between the two pages. Since the data statistics API on the old overview page is no longer updated, data on the new page is used.
- Select a cloud service and view its resource distribution. Alternatively, click a resource group to view its resources.
- Click a service resource to view its alarm details in the right pane.
- Click an instance name to go to the Alarm Records page. Filter all active alarm records by resource ID and resource type.
- Click
 next to an instance name to view all of its alarm records and alarm policies.
 - Click View Details on the right of an alarm policy. On the Alarm Records page, filter the active alarm records that meet the selected alarm policy by alarm severity, alarm rule ID, resource ID, and resource type.
Querying Key Metrics of a Cloud Service
In the lower part of the Resource Monitoring page, you can view the top 5 key metrics for your service and the average values of all instances in the current dimension.
- Log in to the Cloud Eye console.
- Choose Overview.
- In the upper right corner of the Key Metrics area, select a resource dimension from the drop-down list to display resource details or select another resource to view its monitoring details. Figure 1 Viewing key metrics

- Click
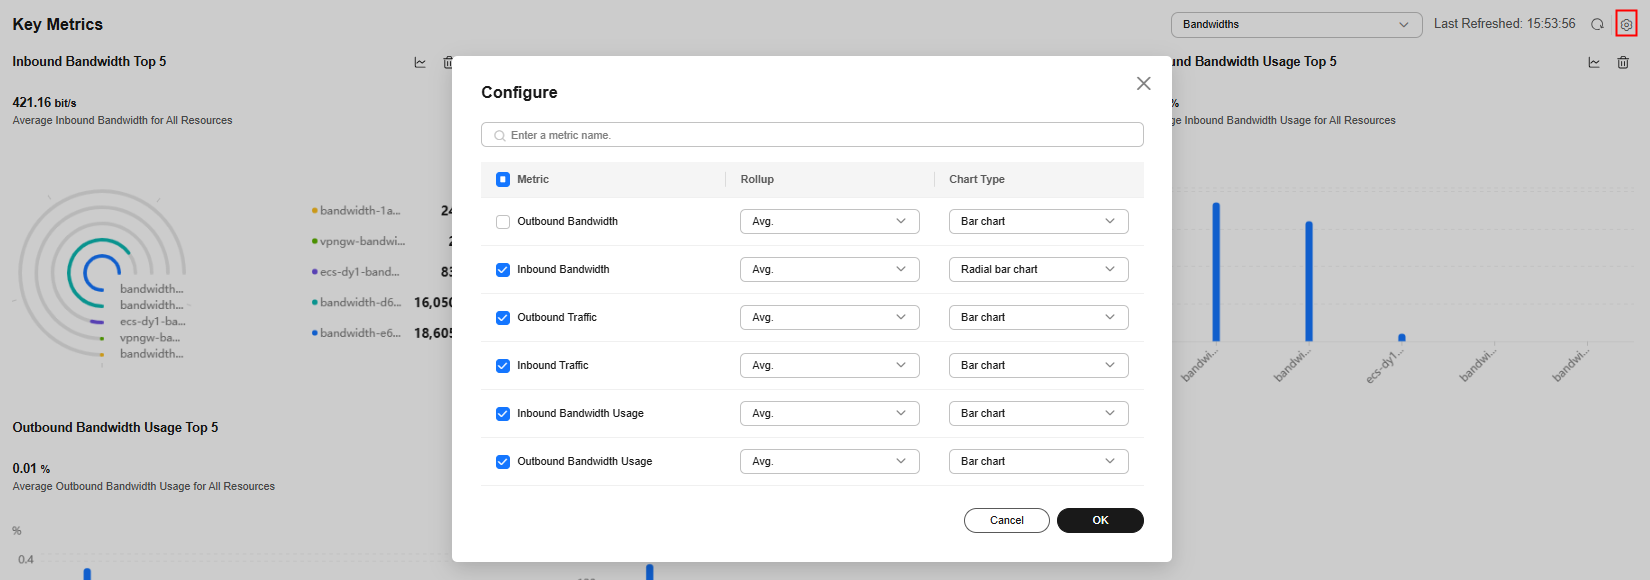
 in the upper right corner of a key metric to select another metric as needed. Configure the aggregation method and chart type for the metric as needed.
 The aggregation method can be Max, Min, Avg, or Sum. The graph type can be Bar chart, Horizontal bar chart, Radial bar chart, or Polar bar chart.
- Click
 in the upper right corner of the graph. In the displayed dialog box, click OK to delete the displayed metrics.
Feedback
Was this page helpful?
Provide feedbackThank you very much for your feedback. We will continue working to improve the documentation.


