Managing Collection Tasks
Monitoring Center provides visualized collection task management. All settings can be retained during the Cloud Native Cluster Monitoring add-on upgrade.
Prerequisites
Cloud Native Cluster Monitoring 3.11.0 or later has been installed.
Managing Collection Tasks
- Log in to the CCE console and click the cluster name to access the cluster console.
- In the navigation pane, choose Settings. Then, click the Monitoring tab.
- Modify the configuration items in Collection configuration.
The collection task configuration consists of the Preset Collection Configuration, ServiceMonitor Collection Configuration, PodMonitor Collection Configuration, and Targets Collection Configuration configuration items.
Preset Collection Configuration

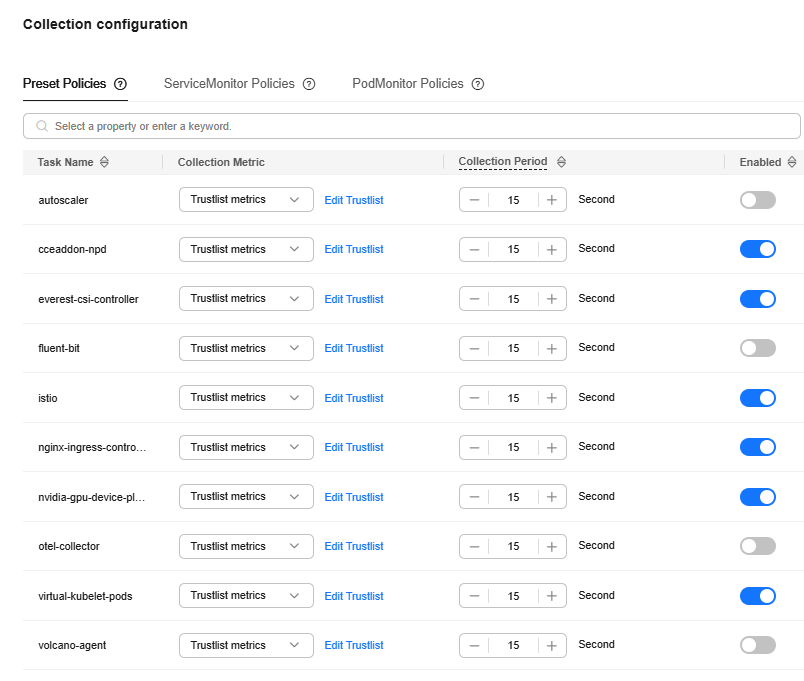
To ensure consistent default behavior of the add-on, preset collection is disabled by default. You are advised to enable preset collection.
Enabling preset collection will convert tasks from the ServiceMonitor or PodMonitor type to visualized collection tasks. The Cloud Native Cluster Monitoring add-on allows for easy management of these tasks. You can enable or disable these tasks based on service needs. You can also add metrics except the basic free ones.
The configuration for managing preset collection tasks can be inherited and retained during the add-on upgrade. In addition, the kube-state-metrics and node-exporter workloads will be centrally managed by Operator. Your custom configuration for the two workloads will be retained to the maximum extent during the add-on upgrade.
- Metric collection management

You can manage the metric collection behavior of each preset collection task as needed.
- If you choose to collect all metrics, all metrics specified by a collection task will be collected.
- If you select the metric collection trustlist, you can add metrics (except the basic free ones) to the trustlist as needed to more accurately control the custom collection content, reduce resource consumption of your cluster, and reduce metric reporting costs.
- Collection task period management
You can customize the collection period of a collection task as needed.

You are advised to set the collection periods of the kubelet, kubelet-cadvisor, kube-state-metrics, and virtual-kubelet-pods collection tasks to the same value.
- Starting and Stopping a Collection Task
You can enable or disable a system collection task as needed.
ServiceMonitor Collection Configuration
You can create, modify, delete, start, and stop a ServiceMonitor as needed. For details about how to create a ServiceMonitor, see Method 4: Configuring ServiceMonitor.

PodMonitor Collection Configuration
You can create, modify, delete, start, and stop a PodMonitor as needed. For details about how to create a PodMonitor, see Method 3: Configuring PodMonitor.

Targets Collection Configuration
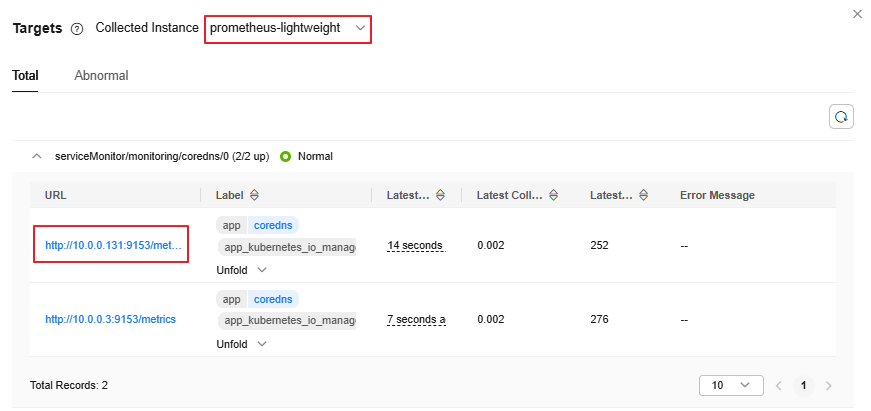
On the Targets page, you can view the collection task status, including the collection endpoint, label, latest collection time, latest collection duration, number of latest collected samples, and error information.
If sharding is enabled for your Cloud Native Cluster Monitoring, there will be multiple collection instances. You can switch one collection instance to another in Collected Instance.

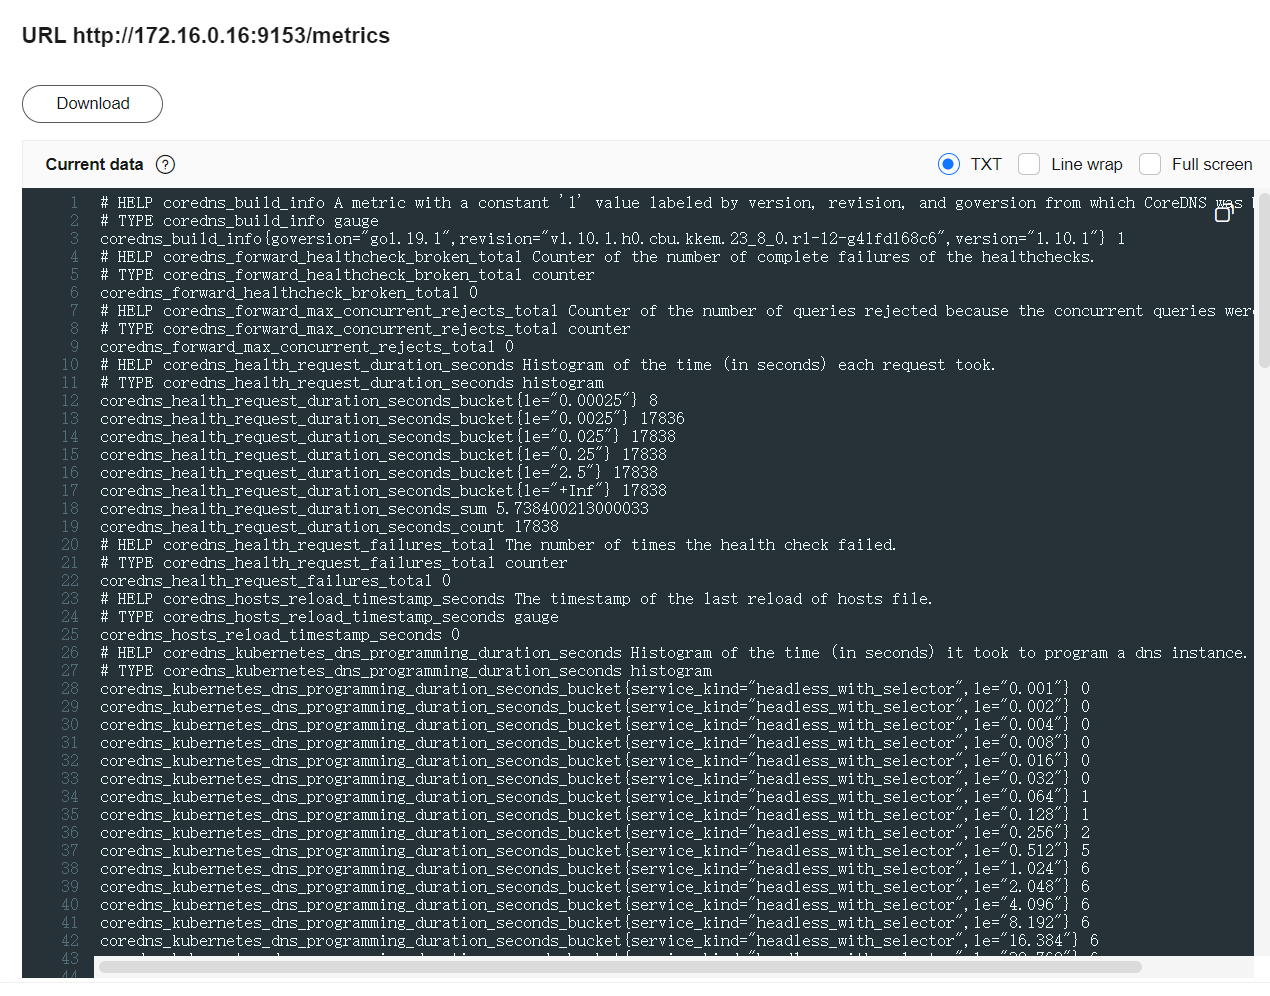
When the Cloud Native Cluster Monitoring add-on is deployed with local data storage disabled, you can directly access the collection endpoint to view, analyze, and manage collection results.

Why Is 403 Displayed in Collection Endpoint Access? How Do I Handle It?
Root Cause
Authentication has been configured for collection tasks in the ServiceMonitor or PodMonitor format corresponding to your collection endpoint. For security purposes, the endpoint to be authenticated cannot be accessed by default.
Solution: You can configure to allow access to endpoints with authentication.

If you allow access to endpoints with authentication, the endpoints to be authenticated can be directly accessed by accessing the prometheus-lightweight service in the cluster. For this reason, do not expose the prometheus-lightweight service port outside the cluster.
- Log in to the CCE console and click the cluster name to access the cluster console.
- In the navigation pane, choose ConfigMaps and Secrets. Then, select All namespaces for Namespace. On the ConfigMaps tab, locate persistent-user-config.
- Click Update to edit lightweight-user-config.yaml and add - --target-response-auto-auth=true under operatorConfigOverride.
customSettings:
  operatorEnvOverride: []
  operatorConfigOverride:
  - --target-response-auto-auth=true
  promAdapterConfigOverride: []
- Click OK to save the configuration. The configuration takes effect in about 1 minute.
Feedback
Was this page helpful?
Provide feedbackThank you very much for your feedback. We will continue working to improve the documentation.


