Collecting Container Assets
Scenarios
HSS can collect information about container assets, including clusters, nodes, containers, images, and container fingerprints. With the container asset function, you can centrally count container assets and detect unsafe assets in a timely manner. This section describes the container asset collection items and how they are collected.
Prerequisite
Container assets have been connected to HSS. For details, see Connecting to a Third-party Image Repository, Accessing CI/CD, and Installing the Agent on Containers.
Constraints
The container fingerprint function is supported only by the HSS enterprise edition. For details about how to purchase HSS, see Purchasing an HSS Quota.
Container Asset Collection Items
The container asset function can collect information about container assets, including clusters, nodes, containers, images, and container fingerprints. Container fingerprints are classified into multiple subtypes, including accounts, open ports, processes, software, auto-started items, web applications, web services, web frameworks, websites, middleware, and databases. For details about assets, see Table 1.
Container Asset Collection Methods
Container asset information can be collected automatically or manually. For details about how each type of fingerprints is collected, see Table 2.
After the agent is installed on a cluster node or independent node, information about server assets will be collected for the first time immediately. By default, the automatic collection period starts from the time when the agent installation succeeded.
Collection intervals can be customized for middleware, web frameworks, kernel modules, web applications, websites, web services, and databases. For details, see Asset Discovery.
|
Item |
Automatic Collection Frequency |
Manual Collection Method |
|---|---|---|
|
Clusters |
Automatic check every 24 hours |
Manually Collecting Cluster, Service, Workload, and Container Information |
|
Nodes |
|
None |
|
Containers |
Automatic check every 24 hours |
Manually Collecting Cluster, Service, Workload, and Container Information |
|
Images |
|
|
|
Accounts |
Automatic check every hour |
Manually Collecting the Latest Asset Fingerprints of All Containers |
|
Open ports |
Automatic check every 30 seconds |
Manually Collecting the Latest Asset Fingerprints of All Containers |
|
Processes |
Automatic check every hour |
Manually Collecting the Latest Asset Fingerprints of All Containers |
|
Installed software |
Automatic check every day |
Manually Collecting the Latest Asset Fingerprints of All Containers |
|
Auto-started items |
Automatic check every hour |
Manually Collecting the Latest Asset Fingerprints of All Containers |
|
Websites |
Once a week (04:10 a.m. every Monday) |
|
|
Web frameworks |
Once a week (04:10 a.m. every Monday) |
|
|
Middleware |
Once a week (04:10 a.m. every Monday) |
|
|
Web services |
Once a week (04:10 a.m. every Monday) |
|
|
Web applications |
Once a week (04:10 a.m. every Monday) |
|
|
Databases |
Once a week (04:10 a.m. every Monday) |
Manually Collecting the Latest Asset Fingerprints of a Single Container
To view the latest data of web applications, web services, web frameworks, websites, middleware, and databases in real time, you can manually collect their fingerprints.
- Log in to the HSS console.Log in to the management console.
- Click
 in the upper left corner and select a region or project.
 - In the upper left corner of the page, click
 and choose .
 - In the navigation pane, choose . Click the Servers tab.
- (Optional) If you have enabled the enterprise project function, select an enterprise project from the Enterprise Project drop-down list in the upper part of the page to view its data.
- Click the name of the target server. On the server details page that is displayed, choose .
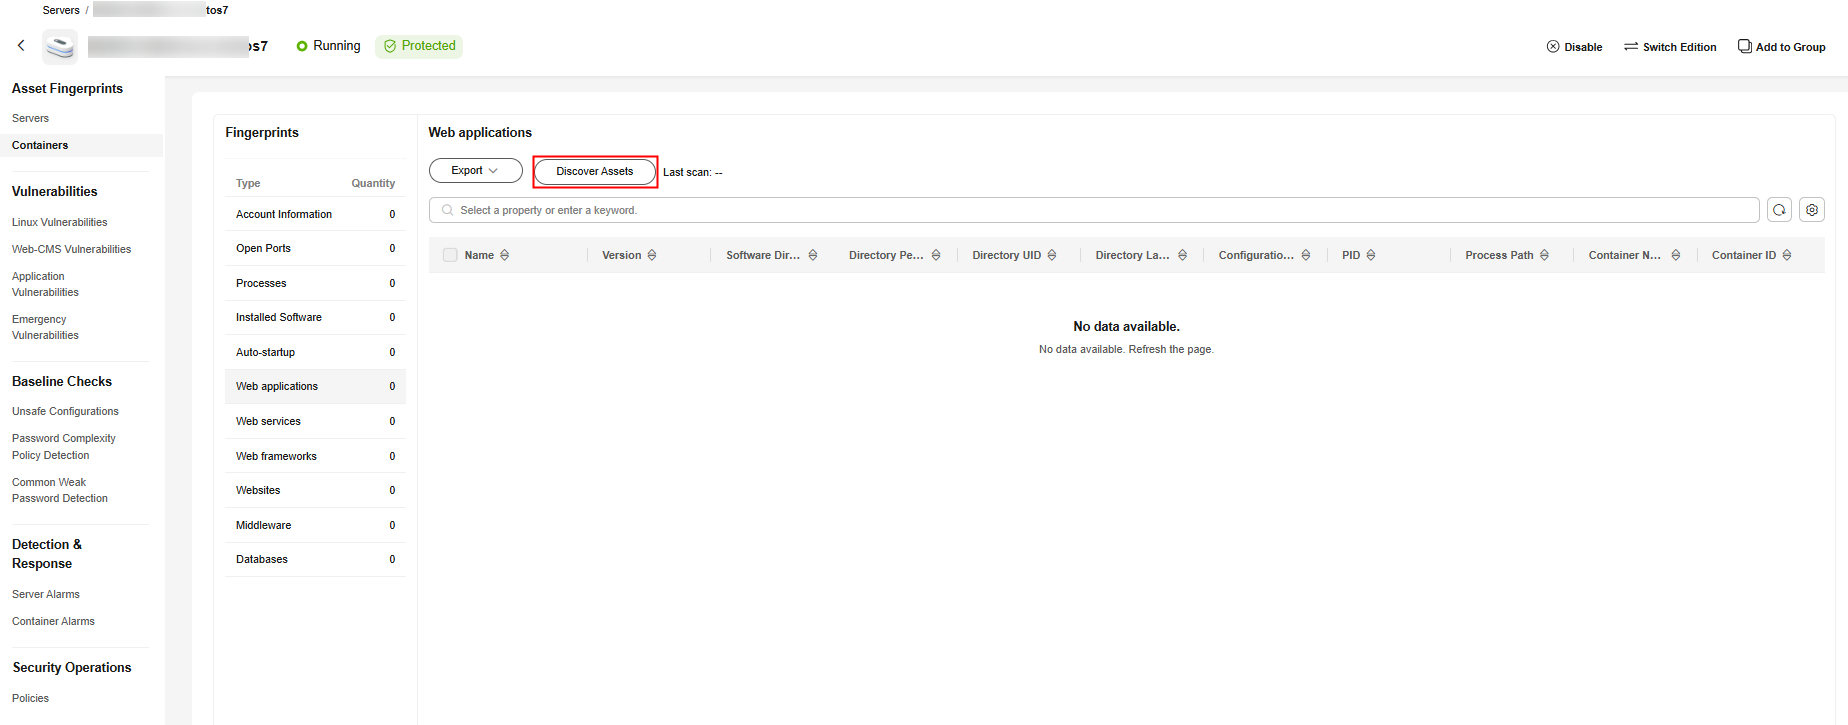
- Click a fingerprint in the fingerprint list, and click Discover Assets on the upper area of the list on the right.
Currently, only Web Applications, Web Services, Web Frameworks, Websites, Middleware, and Databases support real-time manual collection and update. Information about other types is automatically collected and updated every day.
Figure 1 Collecting data now
- After the automatic execution is complete, the last scan time is updated and the latest container asset information is displayed.
Manually Collecting the Latest Asset Fingerprints of All Containers
To view the latest data of accounts, open ports, processes, software, auto-started items, websites, web frameworks, middleware, web services, web applications, and databases in real time, you can manually collect their fingerprints.
- Log in to the HSS console.Log in to the management console.
- Click
 in the upper left corner and select a region or project.
 - In the upper left corner of the page, click
 and choose .
 - Choose .
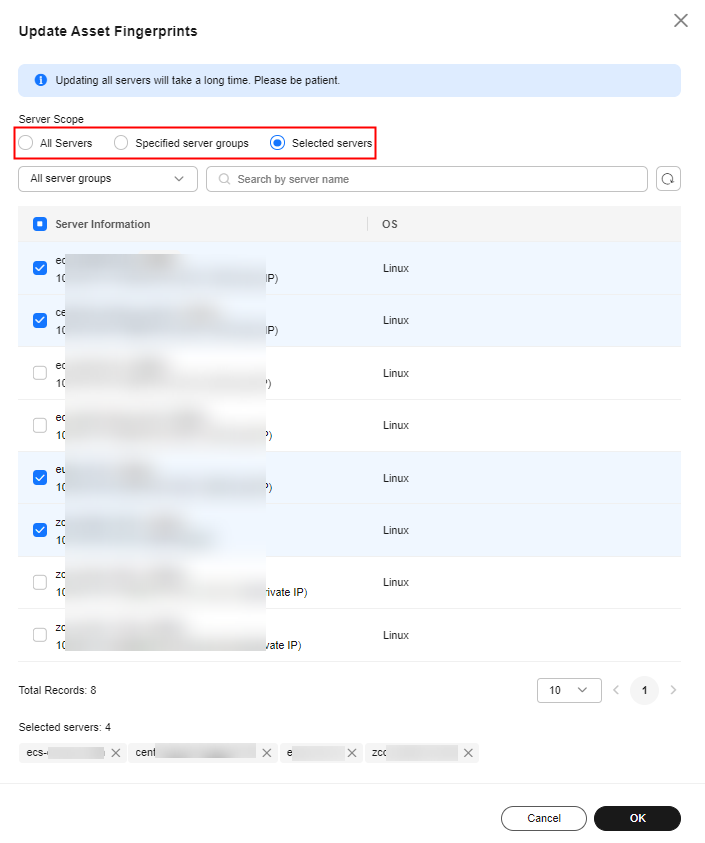
- In the upper right corner of the page, click Update Asset Fingerprints.
- Select the server update scope and click OK.
Figure 2 Updating asset fingerprints

- After the Updating Asset Fingerprints status disappears from the button in the upper right corner of the page, you can view the latest asset fingerprints.
Manually Collecting Cluster, Service, Workload, and Container Information
- Log in to the HSS console.Log in to the management console.
- Click
 in the upper left corner and select a region or project.
 - In the upper left corner of the page, click
 and choose .
 - In the navigation pane, choose Asset Management > Container Assets.
Alternatively, you can choose , click the Cluster tab, and click Synchronize the Latest Assets.
- Click the Cluster tab and click Synchronize Clusters in the upper right corner.
- Wait for about 5 minutes, refresh the cluster page, and view the latest assets after synchronization.
Follow-up Procedure
After the container fingerprints are collected, you can view the latest asset fingerprint data. For details, see Viewing Container Assets.
Feedback
Was this page helpful?
Provide feedbackThank you very much for your feedback. We will continue working to improve the documentation.


