Monitoring Metrics of NGINX Ingress Controller
You can use Prometheus and Grafana to observe the metrics of NGINX Ingress Controller.
The following uses Prometheus as an example to describe how to view the metrics of NGINX Ingress Controller of a cluster.
- Accessing Prometheus
(Optional) Bind a LoadBalancer Service to Prometheus so that Prometheus can be accessed from external networks.
- Monitoring Metrics of NGINX Ingress Controller
Enable metric collection for the NGINX Ingress Controller add-on so that NGINX Ingress Controller metrics are automatically reported.
Prerequisites
- The Cloud Native Cluster Monitoring add-on of 3.9.5 or later has been installed in the cluster. For details about this add-on, see Cloud Native Cluster Monitoring.
- The NGINX Ingress Controller add-on of 2.5.4 or later has been installed in the cluster, and metric collection has been enabled. For details about this add-on, see NGINX Ingress Controller.
Accessing Prometheus
After the Cloud Native Cluster Monitoring add-on is installed, you can deploy workloads and Services. The Prometheus server will be deployed as a StatefulSet in the monitoring namespace.
You can create a public LoadBalancer Service to enable Prometheus access from the Internet.
- Log in to the CCE console and click the name of the cluster with Prometheus installed to access the cluster console. In the navigation pane, choose Services & Ingresses.
- Click Create from YAML in the upper right corner to create a public LoadBalancer Service.
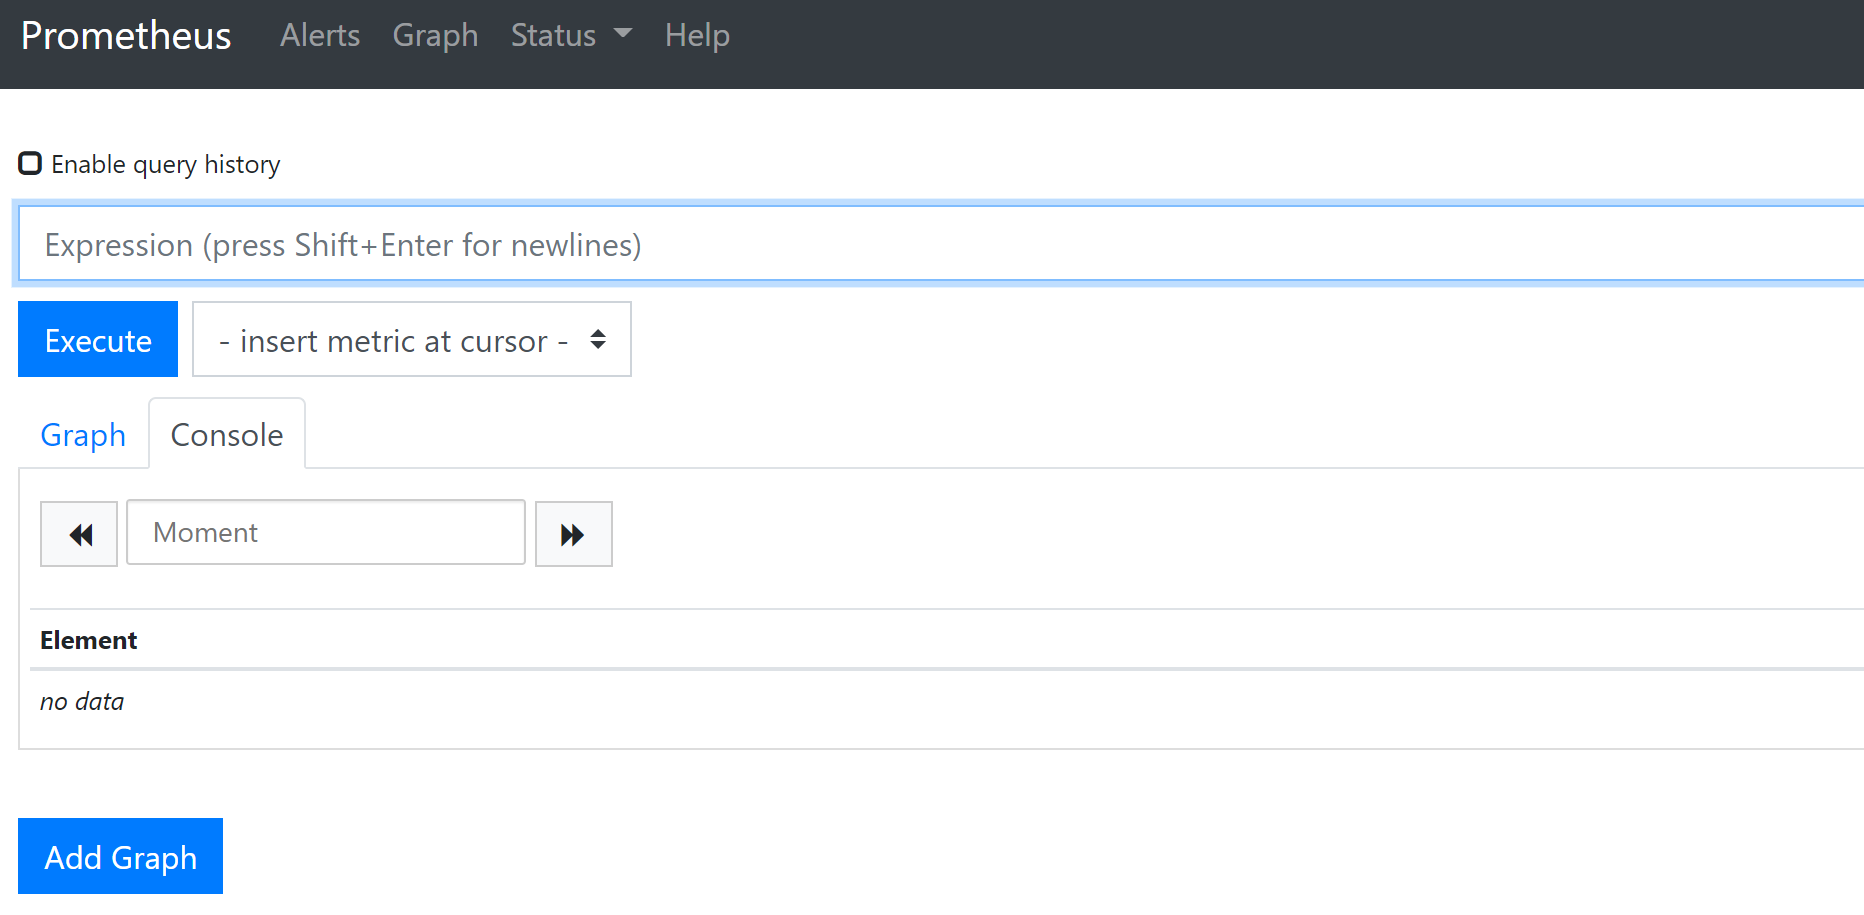
apiVersion: v1 kind: Service metadata: name: prom-lb # Service name, which is customizable. namespace: monitoring labels: app: prometheus component: server annotations: kubernetes.io/elb.id: 038ff*** # Replace it with the ID of the public load balancer in the VPC that the cluster belongs to. spec: ports: - name: cce-service-0 protocol: TCP port: 88 # Service port, which is user-defined. targetPort: 9090 # Default Prometheus port. Retain the default value. selector: # The label selector can be adjusted based on the label of a Prometheus server instance. app.kubernetes.io/name: prometheus prometheus: server type: LoadBalancer - After the Service is created, enter {public-IP-address-of-the-load-balancer}:{Service-port} in the address box of the browser to access Prometheus.
Figure 1 Accessing Prometheus

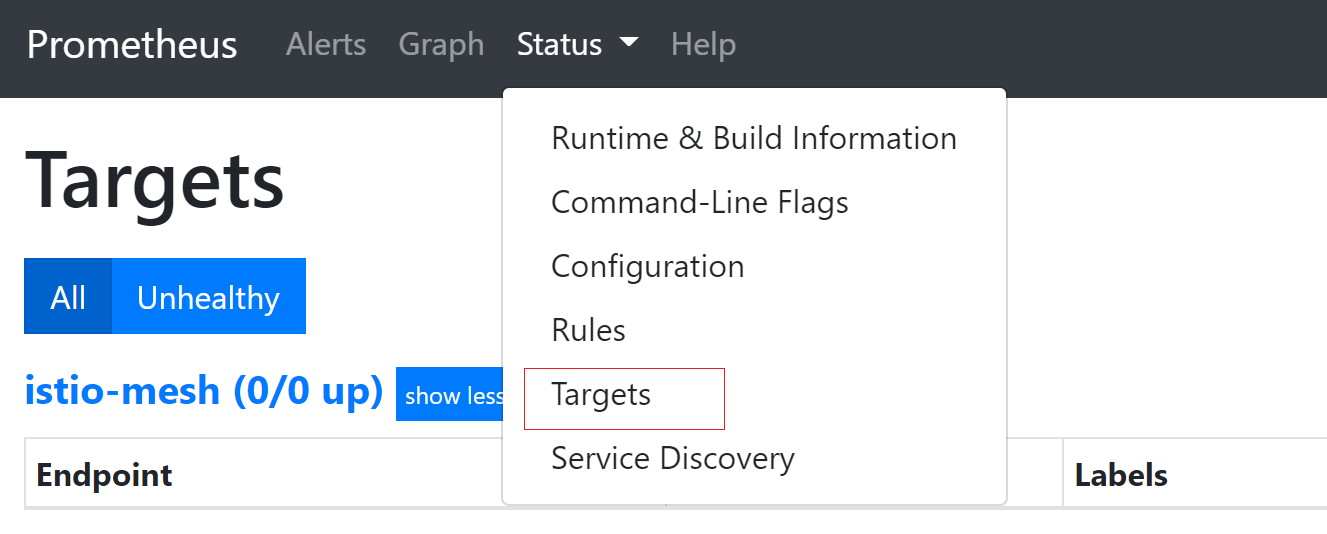
- Choose Status > Targets to view the targets monitored by Prometheus.
Figure 2 Viewing monitored targets

Monitoring Metrics of NGINX Ingress Controller
Log in to Prometheus and click Graph to view the metrics of NGINX Ingress Controller.

|
Category |
Metric |
Type |
Description |
|---|---|---|---|
|
Traffic and request processing metrics |
nginx_ingress_controller_bytes_sent |
Basic metric |
Total number of bytes sent by NGINX Ingress Controller to the client (including all response content, such as the response header and response body). Unit: byte |
|
nginx_ingress_controller_connect_duration_seconds |
Basic metric |
Time taken by NGINX Ingress Controller to establish a connection with the upstream server (backend service). This metric reflects the connection establishment efficiency. Unit: second |
|
|
nginx_ingress_controller_header_duration_seconds |
Basic metric |
Time taken from the moment when NGINX Ingress Controller sends a request to the upstream server to the moment when NGINX Ingress Controller receives the first response header from the upstream server. Unit: second |
|
|
nginx_ingress_controller_ingress_upstream_latency_seconds |
Basic metric |
Total latency for the upstream server to process a request. It is the time taken from the moment when NGINX Ingress Controller forwards the request to the upstream server to the moment when the upstream server returns a complete response. Unit: second |
|
|
nginx_ingress_controller_request_duration_seconds |
Basic metric |
Total processing time from the moment when the client sends a request to NGINX Ingress Controller to the moment when NGINX Ingress Controller returns a complete response to the client. Unit: second |
|
|
nginx_ingress_controller_request_size |
Basic metric |
Total length of a client request, including the request line (for example, GET /api HTTP/1.1), request header (for example, Host: example.com), and request body (for example, POST data). Unit: byte |
|
|
nginx_ingress_controller_requests |
Basic metric |
Total number of client requests received by NGINX Ingress Controller. The number of requests can be collected based on labels such as domain names and paths. Unit: N/A |
|
|
nginx_ingress_controller_response_duration_seconds |
Basic metric |
Time taken by NGINX Ingress Controller to receive the response from the upstream server, including all response bodies. Unit: second |
|
|
nginx_ingress_controller_response_size |
Basic metric |
Total length of the response returned by NGINX Ingress Controller to the client, including the response line (for example, HTTP/1.1 200 OK), response header, and response body. Unit: byte |
|
|
Process status metrics |
nginx_ingress_controller_nginx_process_connections |
Basic metric |
Current number of client connections by state, including active connections (processing requests or waiting for responses), connections that are reading client requests, connections that are returning responses to clients, and idle connections (maintaining the connection status and waiting for new requests). Unit: N/A |
|
nginx_ingress_controller_nginx_process_connections_total |
Basic metric |
Total number of connections, including the number of accepted client connections and the number of connections that have been processed (requests successfully established and processed). Unit: N/A |
|
|
nginx_ingress_controller_nginx_process_cpu_seconds_total |
Basic metric |
Accumulated CPU time used by a process. This metric reflects the CPU resource consumption. Unit: second |
|
|
nginx_ingress_controller_nginx_process_num_procs |
Basic metric |
Number of processes that are running (including the main process and worker processes). Unit: N/A |
|
|
nginx_ingress_controller_nginx_process_oldest_start_time_seconds |
Basic metric |
Start time of the earliest process. The time is expressed as a Unix timestamp (number of seconds since 00:00:00 UTC on January 1, 1970). This metric measures how long a process has been running. Unit: None |
|
|
nginx_ingress_controller_nginx_process_read_bytes_total |
Basic metric |
Number of bytes read by a process from data sources such as disks and networks (for example, reading static files and receiving client request data). Unit: byte |
|
|
nginx_ingress_controller_nginx_process_requests_total |
Basic metric |
Total number of client requests processed by a process. Unit: N/A |
|
|
nginx_ingress_controller_nginx_process_resident_memory_bytes |
Basic metric |
Size of the physical memory (resident memory) currently used by a process, excluding the memory that is swapped to the disk. This metric indicates the hardware memory actually occupied. Unit: byte |
|
|
nginx_ingress_controller_nginx_process_virtual_memory_bytes |
Basic metric |
Total size of the virtual memory used by the process, including the physical memory, swap memory, and unused address space. This metric reflects the memory address range requested by the process. Unit: byte |
|
|
nginx_ingress_controller_nginx_process_write_bytes_total |
Basic metric |
Accumulated number of bytes written by a process (for example, sending responses to clients and writing log files) to the disk, network, and other devices. Unit: byte |
|
|
Controller configuration and status metrics |
nginx_ingress_controller_build_info |
Basic metric |
A constant metric (the value is always 1). The label contains the build information of the controller. Unit: None |
|
nginx_ingress_controller_check_success |
Basic metric |
The frequency at which NGINX Ingress Controller checks the syntax of ingress rules and Nginx configurations. Unit: N/A |
|
|
nginx_ingress_controller_config_hash |
Basic metric |
Hash value of the current Nginx configuration file. This metric is used to check whether the configuration has changed. Unit: None |
|
|
nginx_ingress_controller_config_last_reload_successful |
Basic metric |
Whether the last attempt to reload the configuration is successful. The value 1 indicates that the configuration is reloaded, and the value 0 indicates that the configuration fails to be reloaded. Unit: None |
|
|
nginx_ingress_controller_config_last_reload_successful_timestamp_seconds |
Basic metric |
Unix timestamp when the last Nginx configuration is reloaded. Unit: None |
|
|
nginx_ingress_controller_ssl_certificate_info |
Basic metric |
SSL certificate-related label information (such as the certificate domain name, expiration time, and issuer) to monitor the certificate status (for example, whether the certificate is about to expire). Unit: None |
|
|
nginx_ingress_controller_success |
Basic metric |
The frequency at which NGINX Ingress Controller successfully reloads the configuration. Unit: N/A |
|
|
nginx_ingress_controller_orphan_ingress |
Basic metric |
Status of an isolated ingress. The value 1 indicates that an isolated ingress exists, and the value 0 indicates that no isolated ingress exists. An isolated ingress indicates that the Service or endpoint referenced in the rule does not exist. The labels are as follows:
|
|
|
Admission Controller metrics |
nginx_ingress_controller_admission_config_size |
Basic metric |
Size of the ingress configuration tested by Admission Controller. Unit: byte |
|
nginx_ingress_controller_admission_render_duration |
Basic metric |
Time taken by Admission Controller to render the ingress configuration. Unit: second, floating-point type |
|
|
nginx_ingress_controller_admission_render_ingresses |
Basic metric |
Number of ingresses rendered by Admission Controller. Unit: N/A |
|
|
nginx_ingress_controller_admission_roundtrip_duration |
Basic metric |
Total time taken by Admission Controller to process a complete event (from receiving a request to returning a result). Unit: second, floating-point type |
|
|
nginx_ingress_controller_admission_tested_duration |
Basic metric |
Time taken by Admission Controller to test the ingress configuration. Unit: second, floating-point type |
|
|
nginx_ingress_controller_admission_tested_ingresses |
Basic metric |
Number of ingresses processed by Admission Controller. Unit: N/A |
|
|
Liveness metric |
up |
Basic metric |
Status of the monitored object.
|

When NGINX Ingress Controller is heavily loaded, there will be memory leakage if full metric collection is enabled. For details, see the community issue. It has been verified that the memory usage increase can be effectively suppressed after the following metrics are shielded. To prevent service loss caused by memory leakage, NGINX Ingress Controller shields the following metrics by default. We will continue to pay attention to the latest news in the community and fix this issue in a timely manner.
- nginx_ingress_controller_header_duration_seconds
- nginx_ingress_controller_ingress_upstream_latency_seconds
Feedback
Was this page helpful?
Provide feedbackThank you very much for your feedback. We will continue working to improve the documentation.


