
Comprehensive Monitoring of NPU Metrics
Application Scenarios
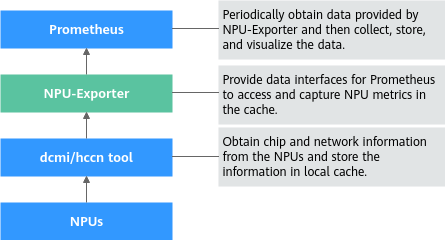
If a cluster contains some NPU nodes, monitoring NPU metrics helps you identify performance bottlenecks, optimize resource utilization, and quickly locate exceptions to improve system stability and efficiency. In CCE standard and Turbo clusters, NPU-Exporter allows real-time monitoring and alarm reporting by uploading NPU metric data collected via DCMI or hccn tool to the cloud native monitoring system. This helps improve system reliability and performance. NPU-Exporter can collect 73 NPU metrics, covering aspects like health, power consumption, and temperature, enabling a detailed view of NPU statuses. For more information, see NPU Metrics.
This section describes how to enable NPU-Exporter and monitor NPU metrics in real time.
Prerequisites
- There is an AI-accelerated node (AI-accelerated ECSs) in the cluster, and the NPU driver of 24.x or later has been installed. To upgrade the NPU driver, take the following steps:

To upgrade the driver, ensure that the NPU firmware is available on the node. Reinstalling the driver will restart the node. You are advised to drain the node before installing the driver. For details, see Draining a Node. Firmware upgrade is not supported for VMs.
If a driver upgrade fails, see "What Can I Do If an NPU Driver Fails to Be Upgraded?" in FAQs > "Chart and Add-on".
- Uninstall the original NPU driver. For details, see Uninstalling the NPU Driver.
- Go to Firmware and Drivers, select the corresponding product model, and download the driver installation package (in .run format) of 24.x or later.
- If the NPU on the node is Snt3 (which can be obtained by running the npu-smi info command after logging in to the node), you need to select Atlas 300I inference card (model: 3010).
- If the NPU on the node is Snt3P3 (which can be obtained by running the npu-smi info command after logging in to the node), you need to select Atlas 300I Pro inference card.
- Read Before You Start to learn about the restrictions and requirements for NPU installation, and install the NPU by referring to Installing a Driver (*.run).
- The CCE AI Suite (Ascend NPU) add-on has been installed in the cluster and its version is 2.1.55 or later.
- The Cloud Native Cluster Monitoring add-on has been installed in the cluster and its version is 3.12.1 or later. To upload NPU metrics to AOM, enable Report Monitoring Data to AOM for the Cloud Native Cluster Monitoring add-on.
Process
| Procedure | Description | Billing |
|---|---|---|
| After NPU-Exporter is enabled, the system can monitor and collect NPU metric data and expose the data in Prometheus-compatible format. | N/A | |
| By default, Cloud Native Cluster Monitoring does not automatically collect or report metrics exposed by NPU-Exporter. You need to go to Settings to manually enable data collection. | N/A | |
| (Optional) To view NPU metrics on AOM, take this step. | The collected NPU metrics in this section are custom metrics. Uploading such metrics to AOM incurs fees. | |
| (Optional) To disable NPU-Exporter after use, take this step. | N/A |
Step 1: Enable NPU-Exporter
NPU-Exporter monitors and collects NPU metric data and exposes the data in Prometheus-compatible format, so that you can use monitoring systems such as Prometheus to monitor NPUs and generate alarms. If the CCE AI Suite (Ascend NPU) add-on version is 2.1.55 or later, NPU-Exporter is supported. To enable NPU-Exporter, take the following steps:
- Log in to the CCE console and click the cluster name to access the cluster console. In the navigation pane, choose Overview. In the navigation pane, choose Add-ons, locate the CCE AI Suite (Ascend NPU) add-on, and click Edit.
- In the Metric-based Observation area, find the Use NPU-Exporter to Observe NPU Metrics parameter, click
 under it, and click OK in the lower right corner. NPU-Exporter is then deployed on the NPU nodes as a DaemonSet to observe NPU metrics. Figure 2 Enabling NPU-Exporter
- After the add-on status changes to Running, click View Details. In the window that slides out from the right, click the Pods tab. If there is an npu-exporter-xxx pod in the pod list and it is in the Running state, NPU-Exporter has been enabled.
Step 2: Collect NPU Metrics
By default, the metrics exposed by NPU-Exporter are not collected and reported by Cloud Native Cluster Monitoring. After installing the Cloud Native Cluster Monitoring add-on, you need to go to the Settings and manually enable data collection. The following cases are involved:
- The target preset policy is disabled: If the Cloud Native Cluster Monitoring add-on has been installed but its preset policy is not enabled in Settings, enable NPU-Exporter data collection on the ServiceMonitor Policies tab in Settings.
- The target preset policy is enabled: If Cloud Native Cluster Monitoring has been installed and its preset policy has been enabled in Settings, enable NPU-Exporter data collection on the Preset Policies tab.
If the Cloud Native Cluster Monitoring add-on has been installed but its preset policy is not enabled in Settings, take the following steps to enable data collection:
- Log in to the CCE console and click the cluster name to access the cluster console.
- In the navigation pane, choose Cluster > Settings. Then, click the Monitoring tab. In the Collection Settings area, find ServiceMonitor Policies and click Manage.
- On the Collection Settings page, click the search box, select Name, choose npu-exporter from the drop-down list, and enable it.
If you have enabled Preset Policies in the Settings, the preset ServiceMonitor and PodMonitor policies will be deleted. As a result, the NPU metric data exposed by NPU-Exporter cannot be reported through ServiceMonitor policies. To collect the NPU-Exporter data, take the following steps:
- Log in to the CCE console and click the cluster name to access the cluster console.
- In the navigation pane, choose Cluster > Settings. Then, click the Monitoring tab. In the Collection Settings area, find Preset Policies and click Manage.
- On the Collection Settings page, click the search box, select Name, and choose npu-exporter from the drop-down list. In the search result, choose All metrics in the Collection Metric column and enable NPU-Exporter.
Step 3: View NPU Metrics on AOM
To view NPU metrics on AOM, ensure that the function of reporting monitoring data to AOM has been enabled in Cloud Native Cluster Monitoring. The collected NPU metrics in this section are custom metrics. Uploading such metrics to AOM incurs fees.
- Go to the AOM console. In the navigation pane, choose Instances. In the right pane, click the name of the AOM instance to which metrics are reported.
- On the page displayed, choose Metric Management. In the right pane, click the Metrics tab, choose the target cluster name from the Cluster drop-down list, and enter NPU in the search box to view NPU metrics.
Step 5: Disable NPU-Exporter
To disable NPU-Exporter after use, take the following steps:
- Log in to the CCE console and click the cluster name to access the cluster console. In the navigation pane, choose Overview. In the navigation pane, choose Add-ons, locate the CCE AI Suite (Ascend NPU) add-on, and click Edit.
- In the Metric-based Observation area, find the Use NPU-Exporter to Observe NPU Metrics parameter, click
 under it, and click OK in the lower right corner.
 - After the add-on status changes to Running, click View Details. In the window that slides out from the right, click the Pods tab. If the npu-exporter-xxx pod disappears in the pod list, NPU-Exporter has been disabled.
Feedback
Was this page helpful?
Provide feedbackThank you very much for your feedback. We will continue working to improve the documentation.


