Configuring Grafana to Connect to DLI for Data Query and Analysis
Grafana is an open source tool that offers a variety of chart types to visualize data. It allows you to analyze and display data stored in DLI in a unified manner.
This section describes how to configure Grafana to connect to DLI.
Preparations
- Environment requirements:
Make sure that your system environment meets the following requirements:
- Toolkits:
- DLI's Grafana driver: dli-grafana
- Grafana installation package:
Download Grafana at its official website.
Choose a version that is compatible with your OS. You are advised to choose a version later than 11.0.0.
Download and extract the Grafana installation package, and install Grafana by following its official documentation.
- Connection information:
Table 1 Connection information Item
Description
DLI's AK/SK
AK/SK-based authentication refers to the use of an AK/SK pair to sign requests for identity authentication.
DLI's endpoint address
Endpoint of a cloud service in a region.
DLI's project ID
Project ID, which is used for resource isolation.
DLI's region information
DLI's region information
Step 1: Install the dli-grafana Driver in Grafana
- Obtain the dli-grafana plug-in from the DLI console.
- Save all files in the dist directory of the downloaded and decompressed dli-grafana plugin to the data/plugins/dli-datasource folder in the Grafana installation directory (if the folder does not exist, manually create it).
- In the conf/defaults.ini file in the Grafana installation directory, set the following parameter to allow unsigned drivers to be loaded:
allow_loading_unsigned_plugins = dli-datasource
- Restart the Grafana service to load the dli-grafana driver.
Step 2: Access Grafana
- Access Grafana using a browser with default port 3000.
IP address of the host where Grafana is installed:Port
Example: http://127.x.x.x:3000
- Enter the Grafana administrator username and password.
Step 3: Connect Grafana to DLI
- In the Grafana sidebar, click Data Sources.
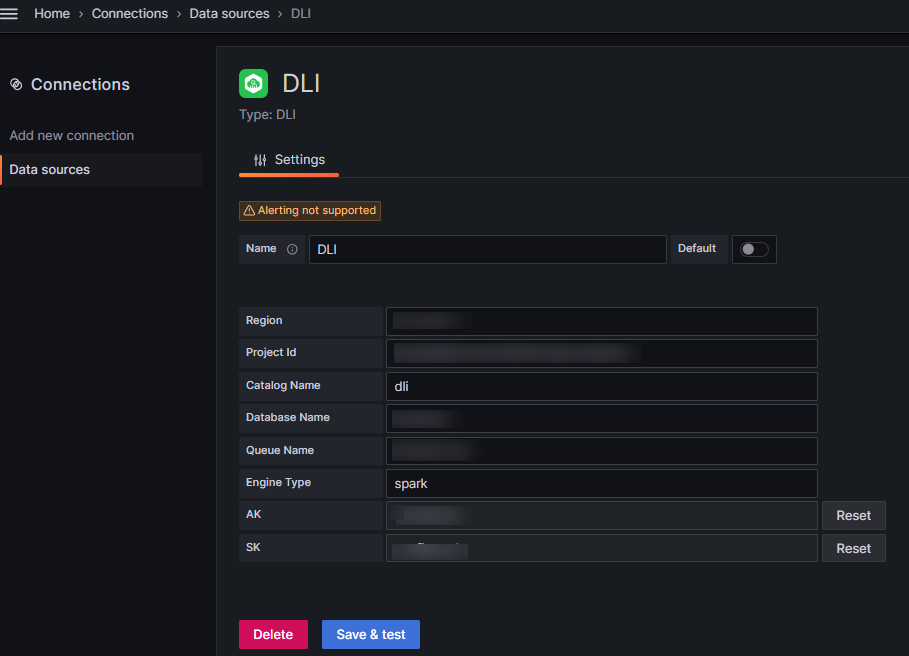
- Click Add data source and select dli-datasource as the data source type.
Set parameters based on Figure 1.
- Click Save & Test to verify if the connection is successful.
Step 4: Create a Dashboard and Submit a SQL Query
- On the Grafana home page, click + New to create a dashboard.
- Add a new panel and select a chart type for your data.
- In the panel settings, select the configured dli-datasource as the data source.
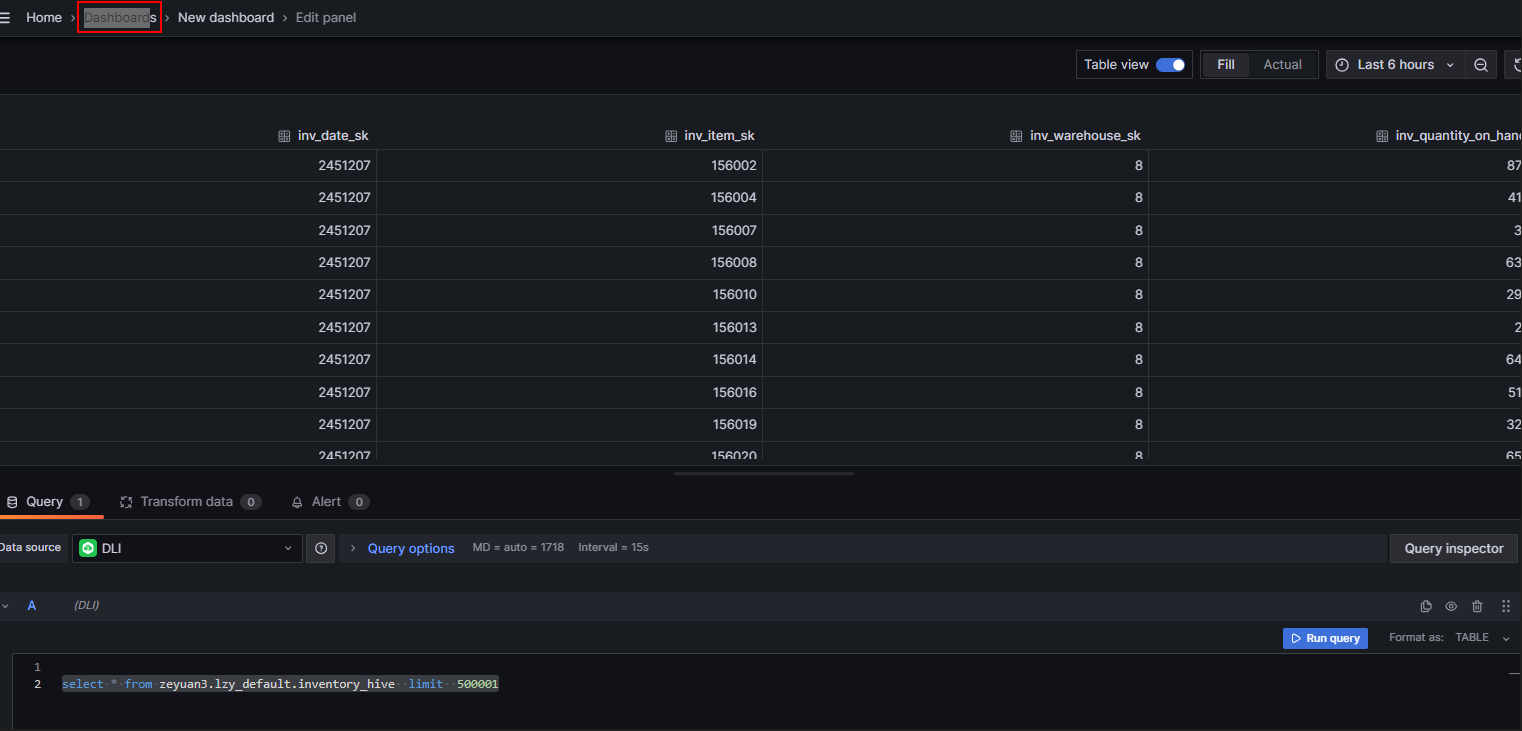
- Enter your SQL query statement, preview the query result, and adjust the chart settings to meet your needs.
- Save the panel and dashboard. Then, use the dashboard to monitor and analyze the data stored in DLI.
Figure 2 Submitting a SQL query in the dashboard

Feedback
Was this page helpful?
Provide feedbackThank you very much for your feedback. We will continue working to improve the documentation.


